PWR
Bullish: Power stock rockets 337 W as Aliens: Dark Descent opens
19h ago
Hardware activity and game frame times, captured locally. Inspect changes and the applications behind them on one shared timeline.
Capture at one tick per second during activity and games, easing to one every five seconds while idle. Available readings depend on your hardware. The Capture page shows storage growth and resource use on your own machine.
Hardware overview shows what changed. Process overview shows what is running now, with a sortable table and resource-flow diagram. Dedicated pages keep the details nearby, and custom workspaces let you arrange your own investigation.
Read a signal as a timeline, a distribution or a breakdown. Add moving averages, limits and your own notes. Automatic markup highlights unusual readings; Findings keeps proposed explanations separate from your decisions.
Frame timing comes from PresentMon. The optional counter is a separate window, without injection into the game process. Revisit a captured session to inspect frame rate, slow frames and the hardware activity around them.
Arrange custom pages, keep your own studies and drawings, and connect an assistant you choose. A local model can keep the conversation on your PC. A hosted model receives the questions and tool results used to answer them.
Captured on a real machine
Process overview
Available capacity takes one path. Applications take the other.
Interactive example loading.
Overview
Trading terminals have had decades of work poured into one problem: making a river of numbers legible. Candles, envelopes, distributions, screeners, a tape across the top.
Almost none of that craft depends on the numbers being prices. It reads a processor, a graphics card, a drive and a wall socket just as well.
The charts sit on a capture service running on your own hardware. Active capture runs once a second. Original readings are kept until the history window or disk budget reaches its limit.
What comes out is a terminal for a single machine. The questions turn out to be the same ones: what was normal, when did it change, and what moved with it.
Resource use varies with hardware, captured activity and the charts you open. Settings shows the capture and window processes separately. Closing the window keeps capture running and releases its browser resources shortly afterwards.
Windows and supported drivers expose activity counters. SystemChart captures those values without installing a hardware-access driver. Derived readings, including estimated wall power, are calculated from the captured data.
Hardware readings share timestamps so you can compare activity across charts. Some sensors and application samples arrive less frequently. Active capture runs at 1 Hz and idle capture at 0.2 Hz. Frame timing follows the game itself.
Captured samples are compressed without deliberately reducing their detail as they age. A wide chart requests bucket averages with minimum and maximum values to fit the display. The original samples remain available while retained.
Any span is read back out of the readings themselves. When the budget you set fills, the oldest ticks are dropped to make room for new ones. Reach is what gives way, never resolution.
Every tick
The available readings depend on the machine and its drivers. Graphics load and memory use can fall back to Windows counters. Unsupported sensors stay absent. Power estimates are labeled separately. Application attribution covers sampled processes, with more consistent tracking for applications you follow.
Frames are the exception. They are counted as the game presents them, at its rate and not the recorder's, so a session at 240 Hz is measured at 240 Hz. When data points are added they are listed in the changelog, with the version they arrived in.
The one number this does not have
CPU package temperature is not captured. SystemChart does not install the hardware-access driver normally needed for that reading.
A Windows thermal-zone reading is not necessarily CPU package temperature. It is not substituted for a sensor the application cannot access.
GPU and drive temperatures appear where their drivers expose supported readings. Availability varies, including between graphics vendors.
Cost tracker
Estimate energy use from captured activity and your electricity rate. CPU and platform draw and power-supply losses are modeled. GPU board power is measured where supported. A plug-in meter is needed for actual wall-power measurement.
Use the energy rate in dollars per kilowatt-hour. The current display uses US dollars and excludes standing charges.
Set the rate and check the processor's modeled maximum power. A non-reporting GPU also has a power estimate to configure.
The Power page shows estimated energy over the selected range and the components contributing to wall draw.
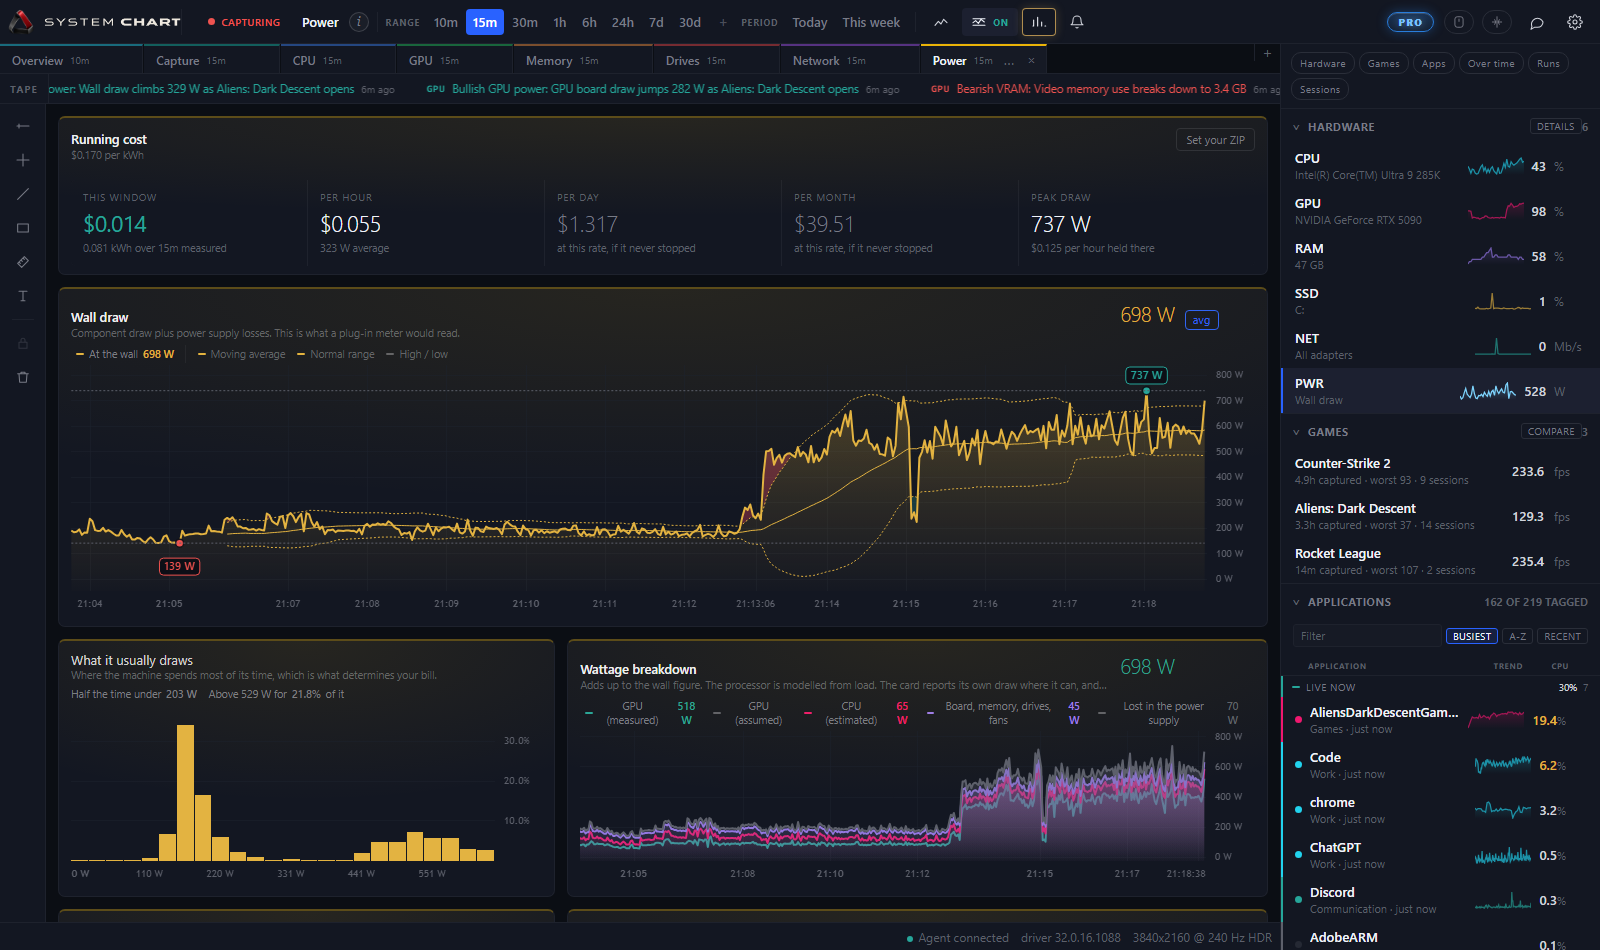
The processor, graphics card, platform and estimated supply losses add up to the wall-power model. Compare similar workloads, and calibrate the assumptions against a meter when accuracy matters.
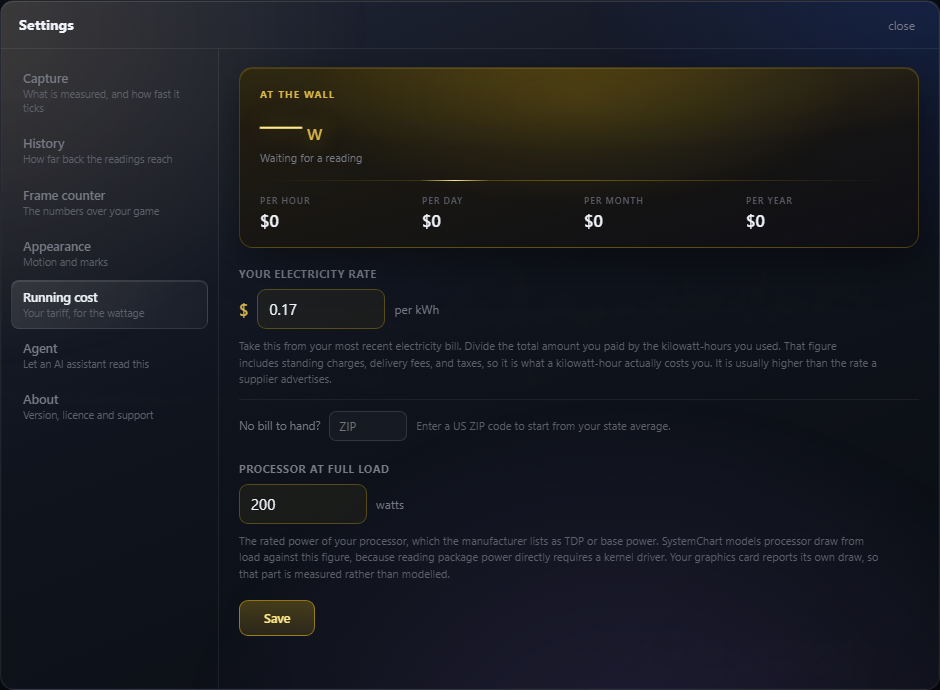
Set the tariff and it applies to everything already captured, not just to what happens next. A year of history becomes a year of spend the moment you type it in.
The pages
There is nothing to assemble before the application is useful. Every page below is there the first time you open it, laid out by somebody who knew what that part of a machine does and which of its readings belong beside each other.
They are ordinary pages, not a locked template. Any of them can be copied, rearranged, added to or thrown away, and the original is always one click back. Flip through them here.
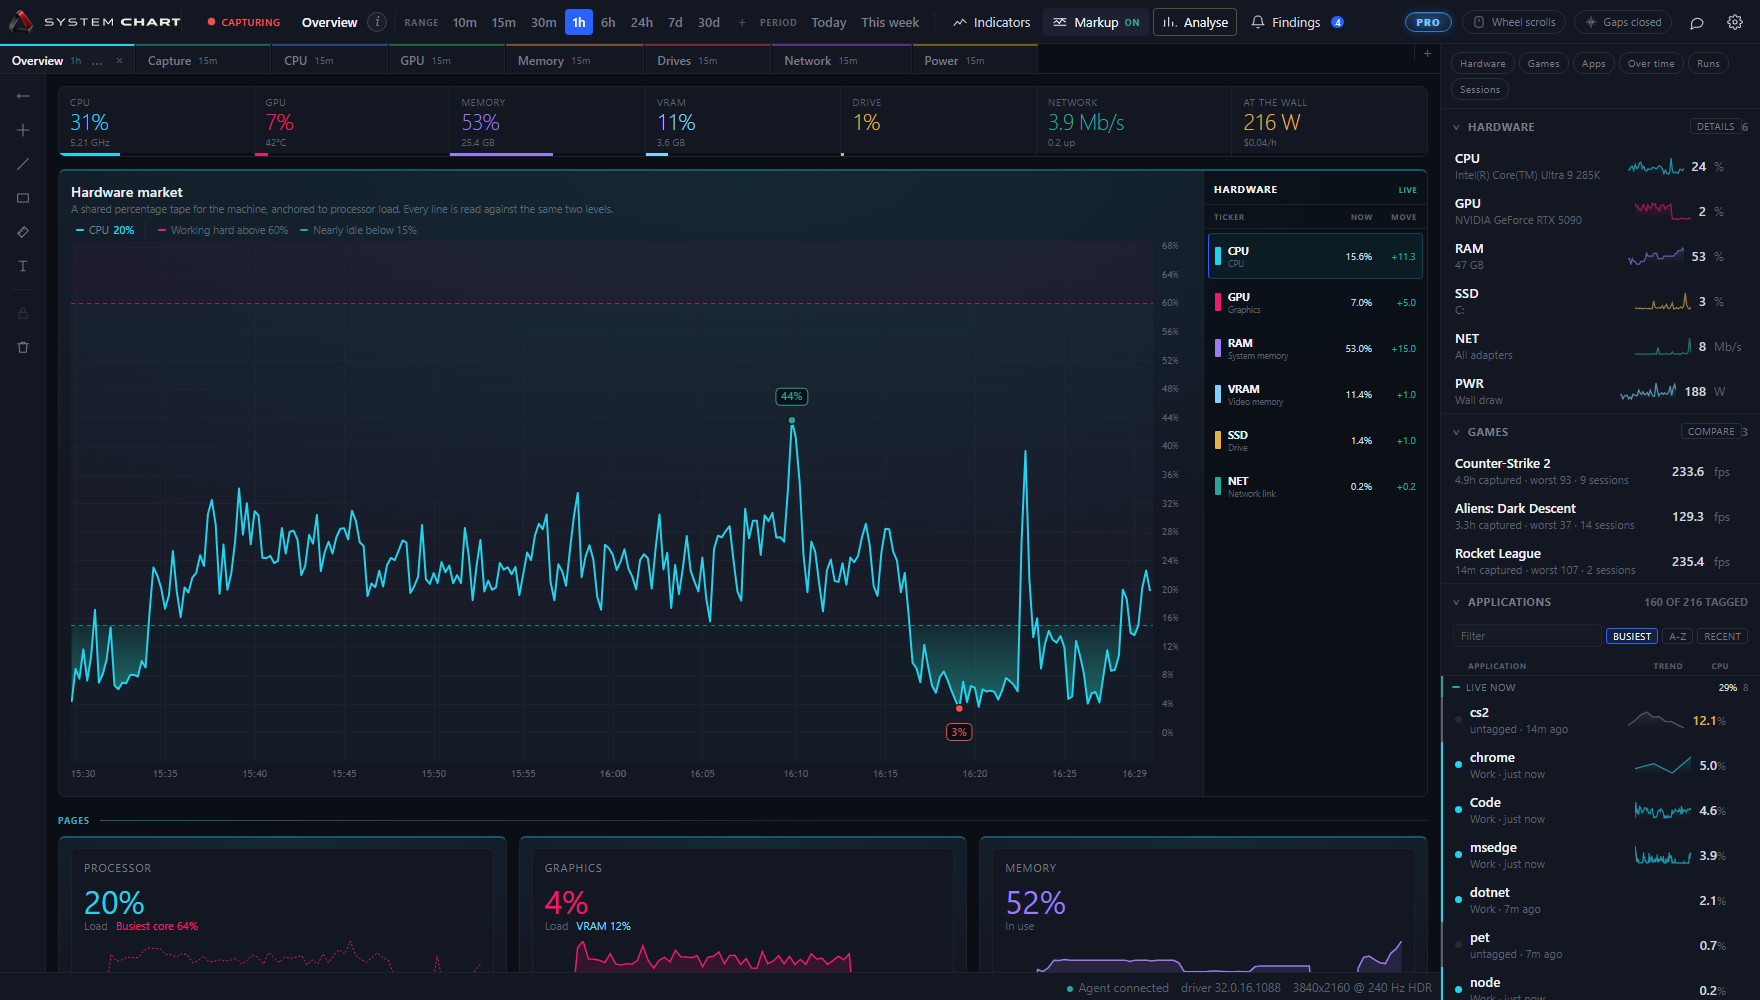
Start with processor load and add comparable percentage readings from graphics, memory, drives or the network. Each line keeps its own meaning; this is not a synthetic score for the whole machine.
Reads selected hardware readings, their latest values and their changes, what is running right now, and the last few things worth telling you about.
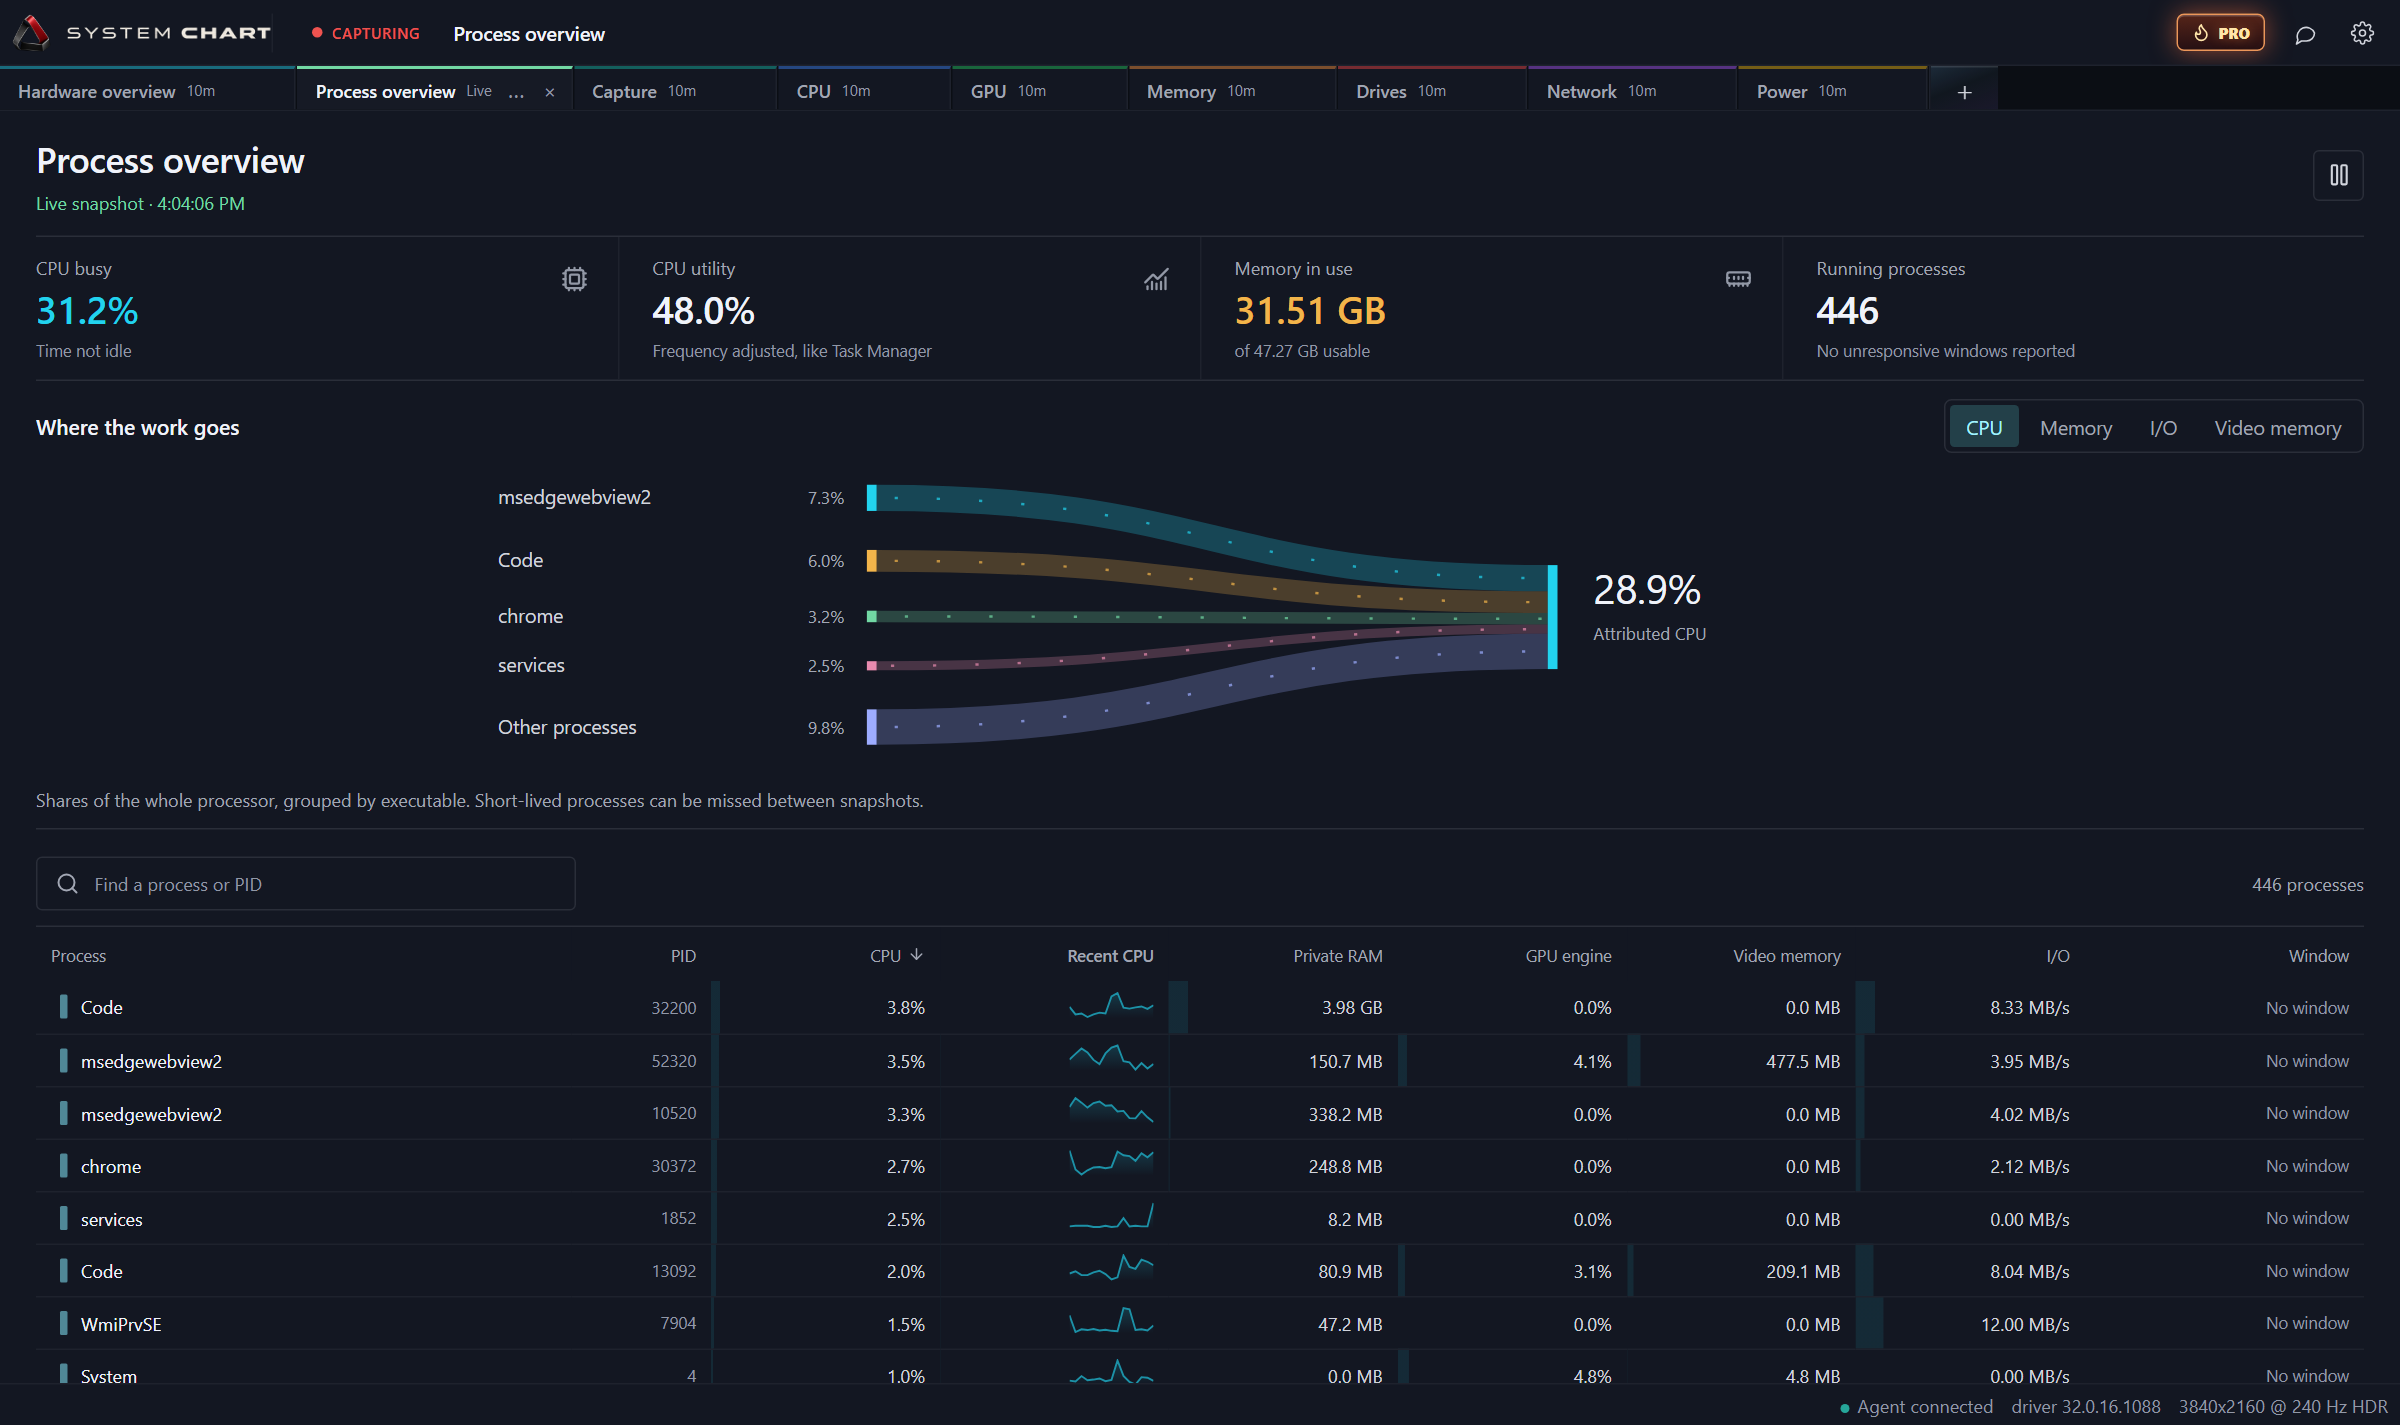
See what is using the machine now. Switch the flow diagram between CPU, memory, process I/O and video memory. Search or sort the table, then open an application's captured history for context.
Shows CPU busy time and frequency-adjusted Windows utility separately. Process I/O is not the same as disk throughput. Unknown readings stay distinct from zero.
A visible window's response state can help identify a stalled application. Ending a process requires confirmation in the desktop app and may lose unsaved work. Protected processes are refused.
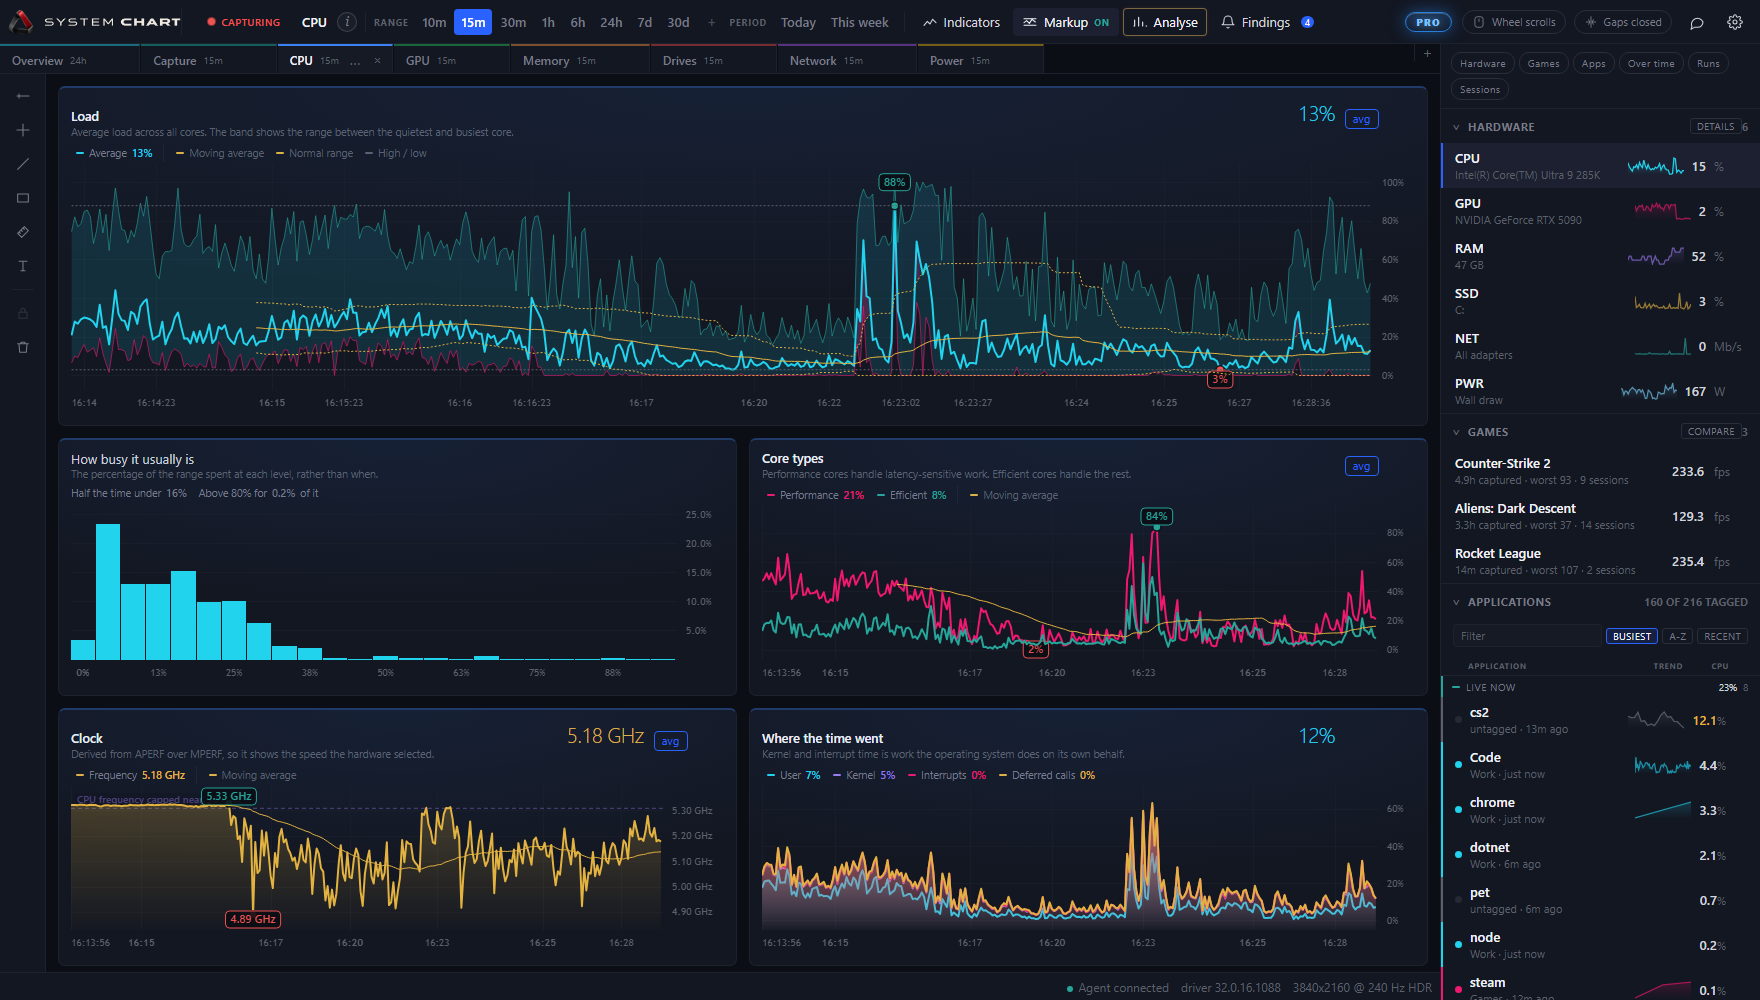
Load with its own normal range drawn behind it, so a busy afternoon is visibly busy rather than merely high. Kernel and user time are split apart, because work the machine is doing on its own behalf is a different problem from work you asked for.
Tracks load average, minimum and maximum, clock speed, busy cores split across performance and efficiency, kernel, user, deferred procedure call and interrupt time, context switches, queue length, thread count, Windows utility and reported performance limits. These limits are not temperature readings.
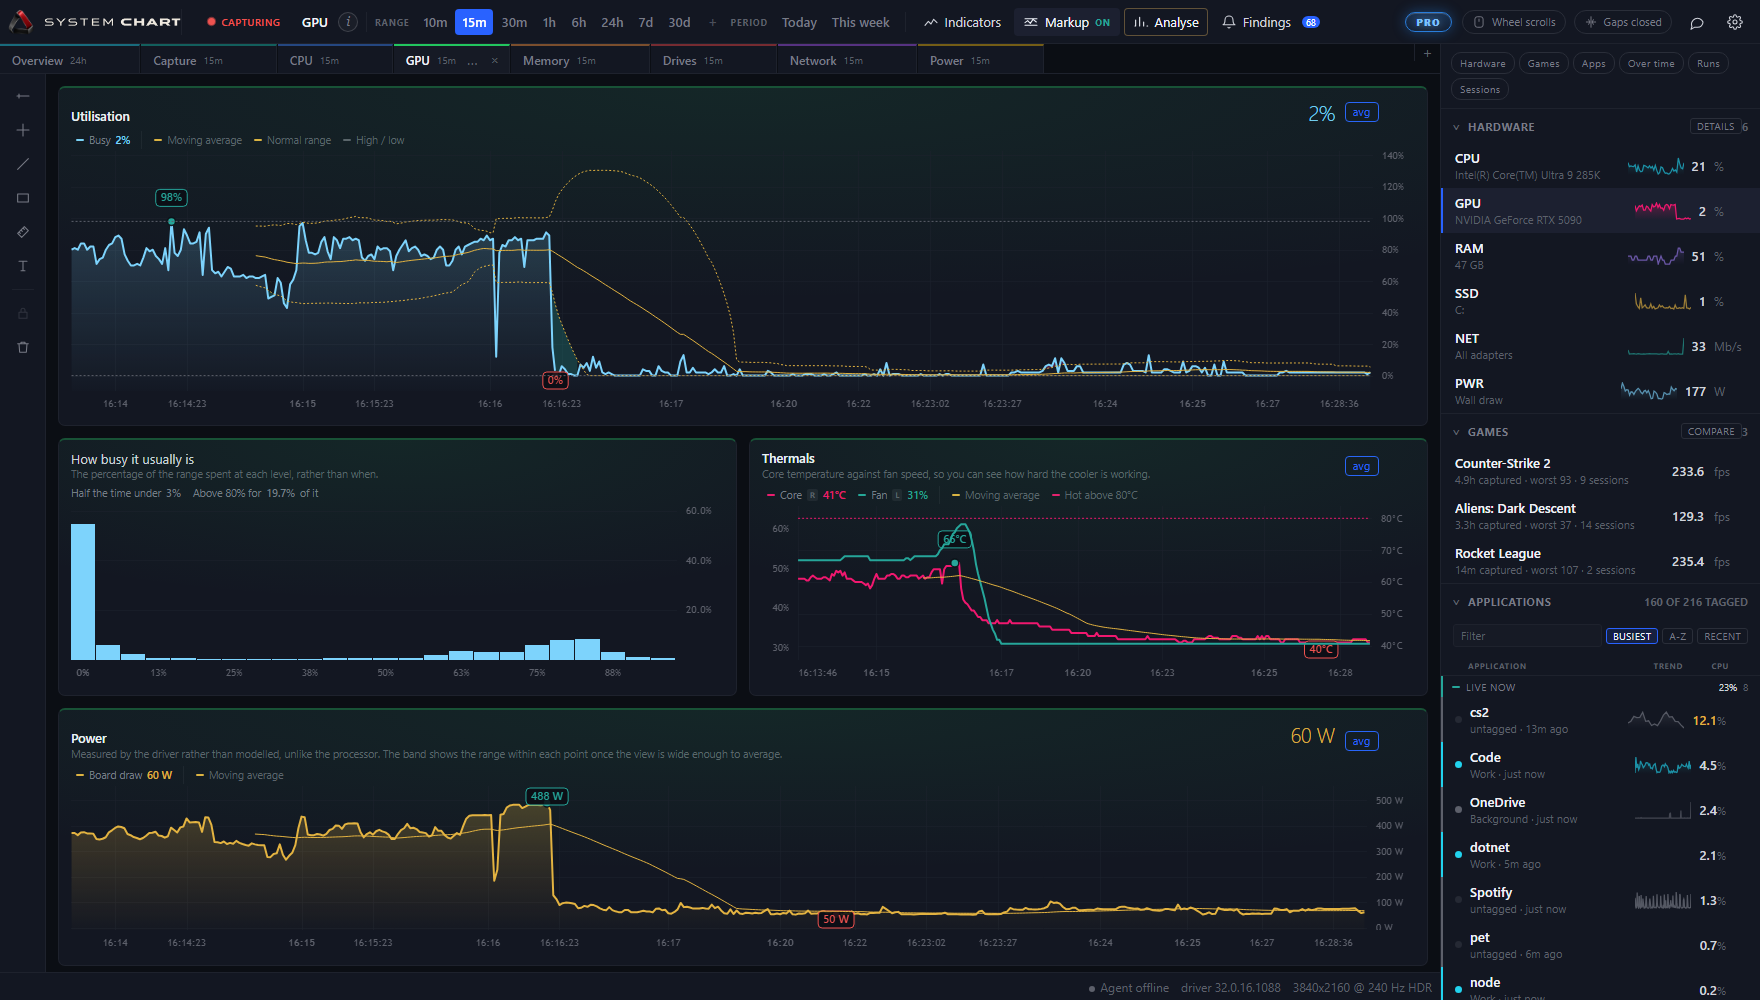
Compare load, temperature, fan speed and the limits reported by supported cards. The cooling baseline is the coolest captured GPU reading, not a room thermometer. Room temperature and fan behavior can still affect comparisons.
Tracks supported load, memory controller load, temperature and cooling estimates, board power against its limit, core and memory clocks, fan, video memory used and its share, the encoder and decoder engines, bus traffic both ways, and whether the card says it is throttling and for which reason.
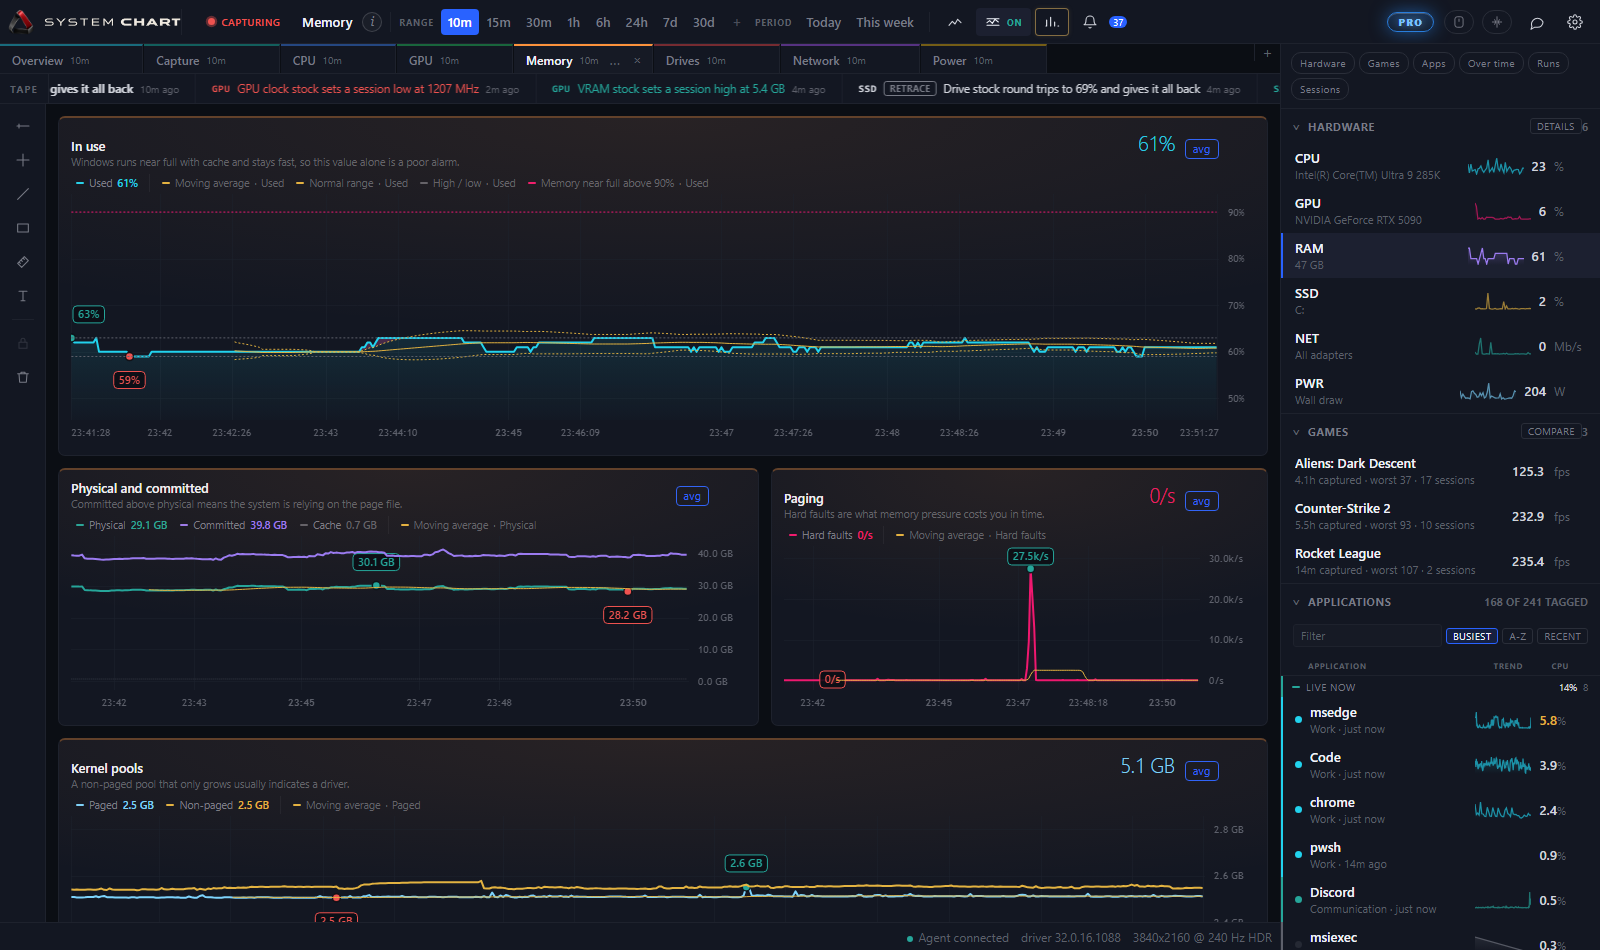
See which applications hold memory, then compare resident use, committed memory and paging activity. Hard faults can come from mapped files as well as the page file, so check drive activity before drawing conclusions.
Tracks memory in use, commit charge, the file cache, soft and hard page faults, and paged and non-paged pool.
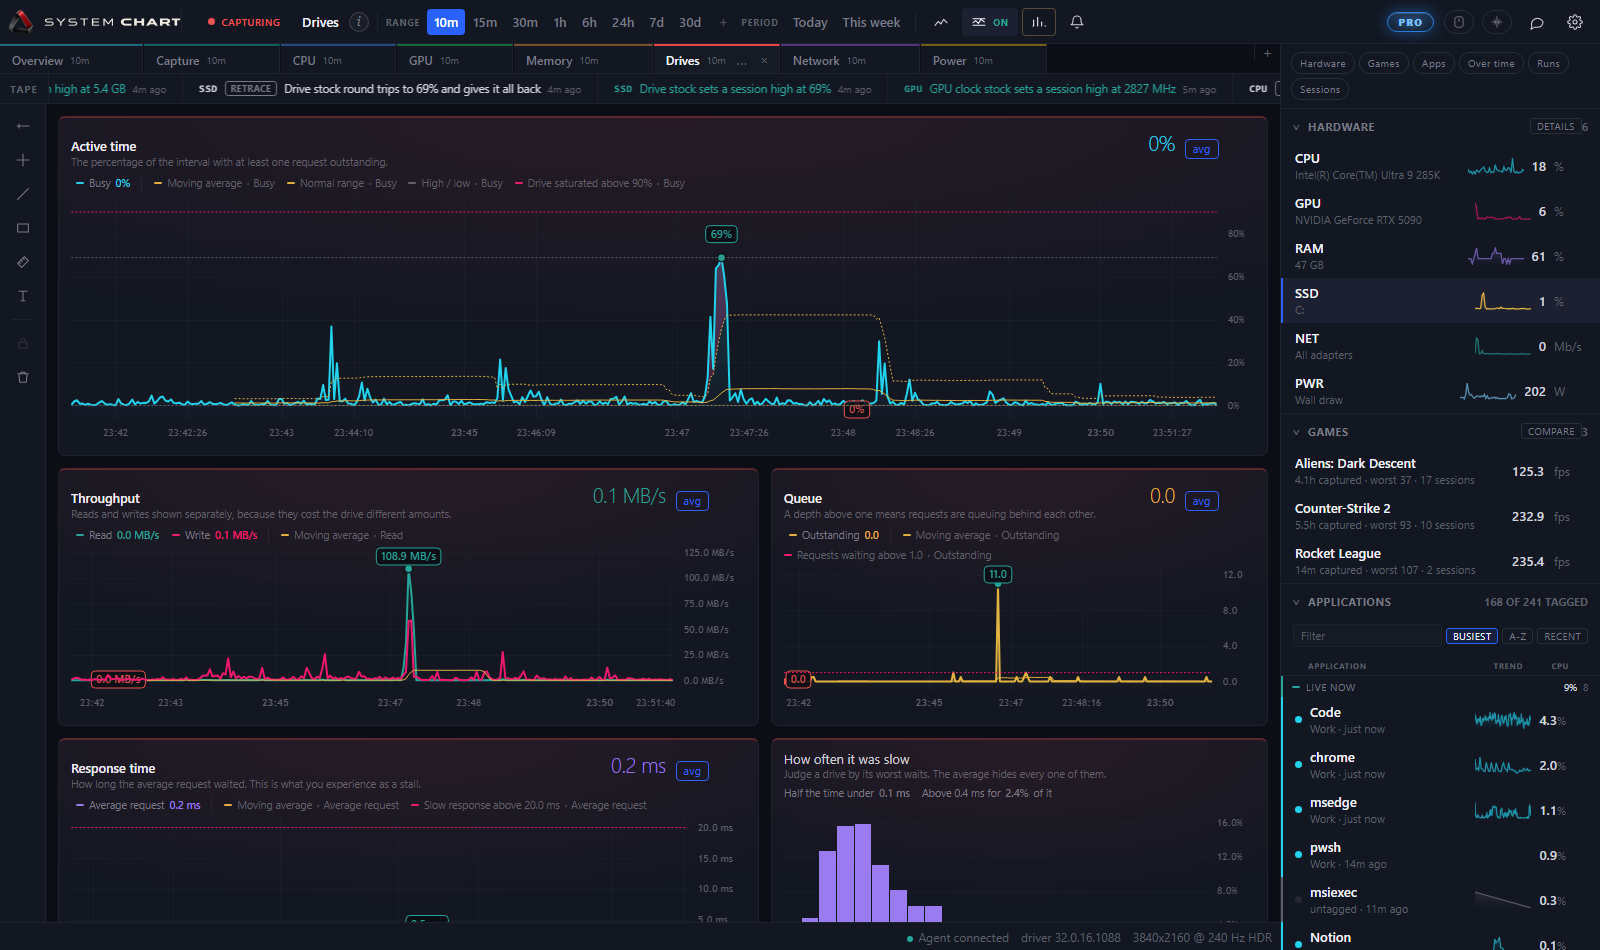
Throughput is the reading everybody looks at and latency is the one that explains the day. A drive can be moving very little and still be the reason nothing responds, which is only visible with both on the page.
Tracks load, megabytes read and written a second, latency, operations a second, queue depth, drive temperature every ten seconds, and free space on every volume.
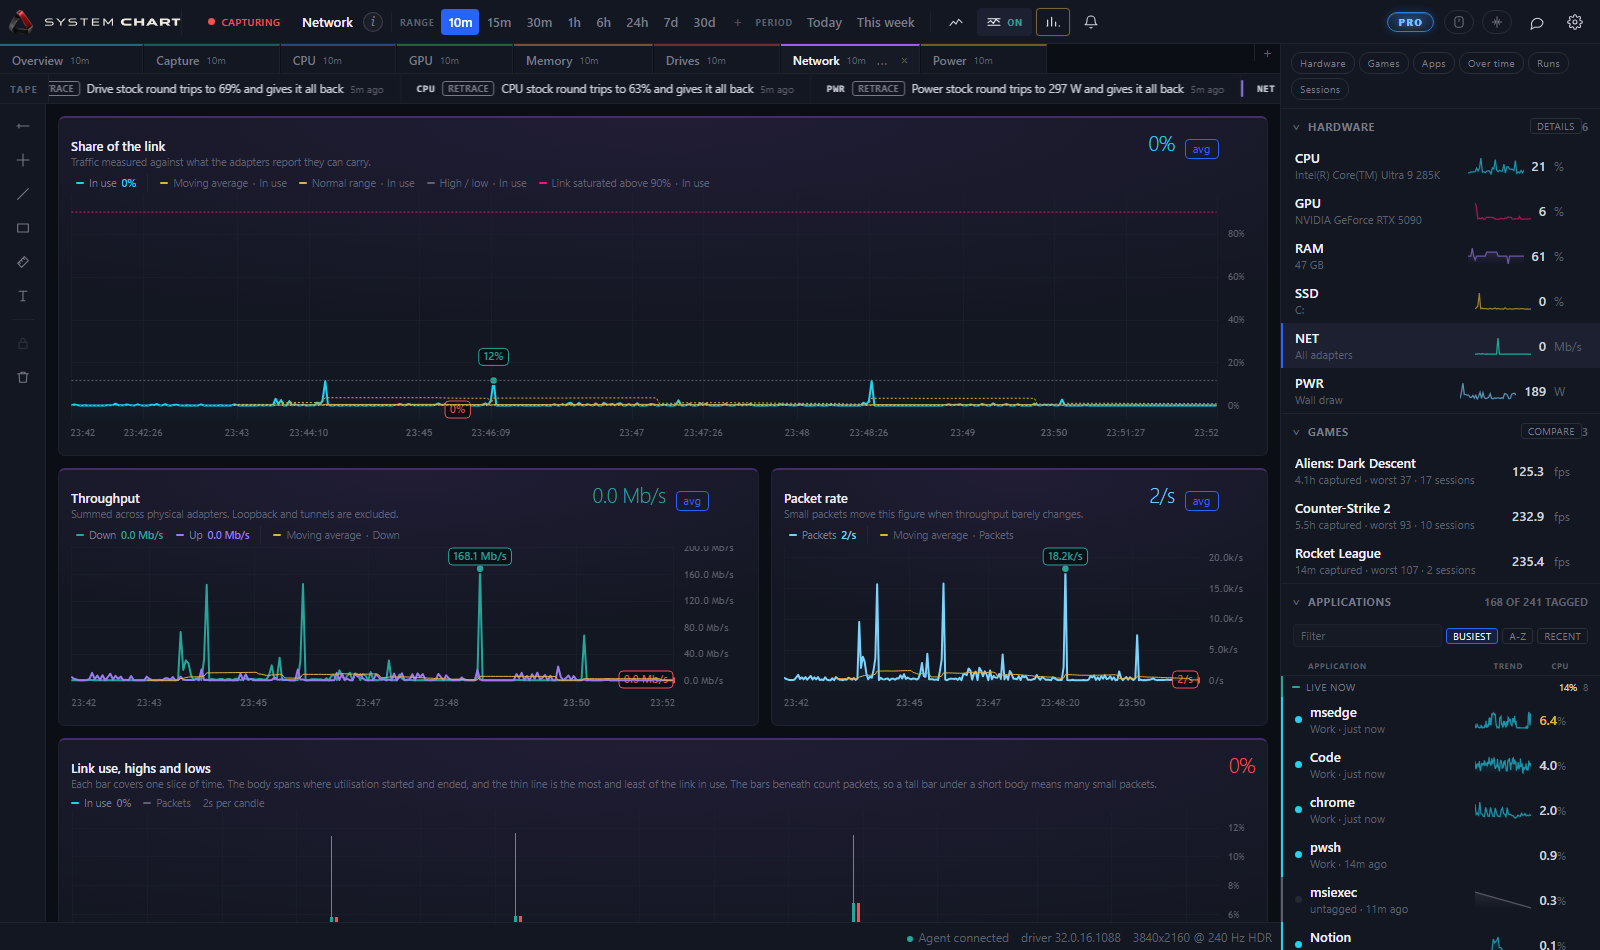
Compare received and sent traffic with link utilization. Errors and discards provide additional evidence when investigating a connection; they do not, on their own, identify a faulty cable or the cause of a slowdown.
Tracks received and sent, utilisation as a share of the link, the link rate itself, packet counts, errors and discards.
Estimated wall power, separated into its components. Apply your electricity rate to estimate the energy cost of the selected range. The current tariff is applied to historical readings too.
Tracks processor, graphics and platform watts, the estimated draw at the wall and at the supply, load, and the cost at your own tariff.
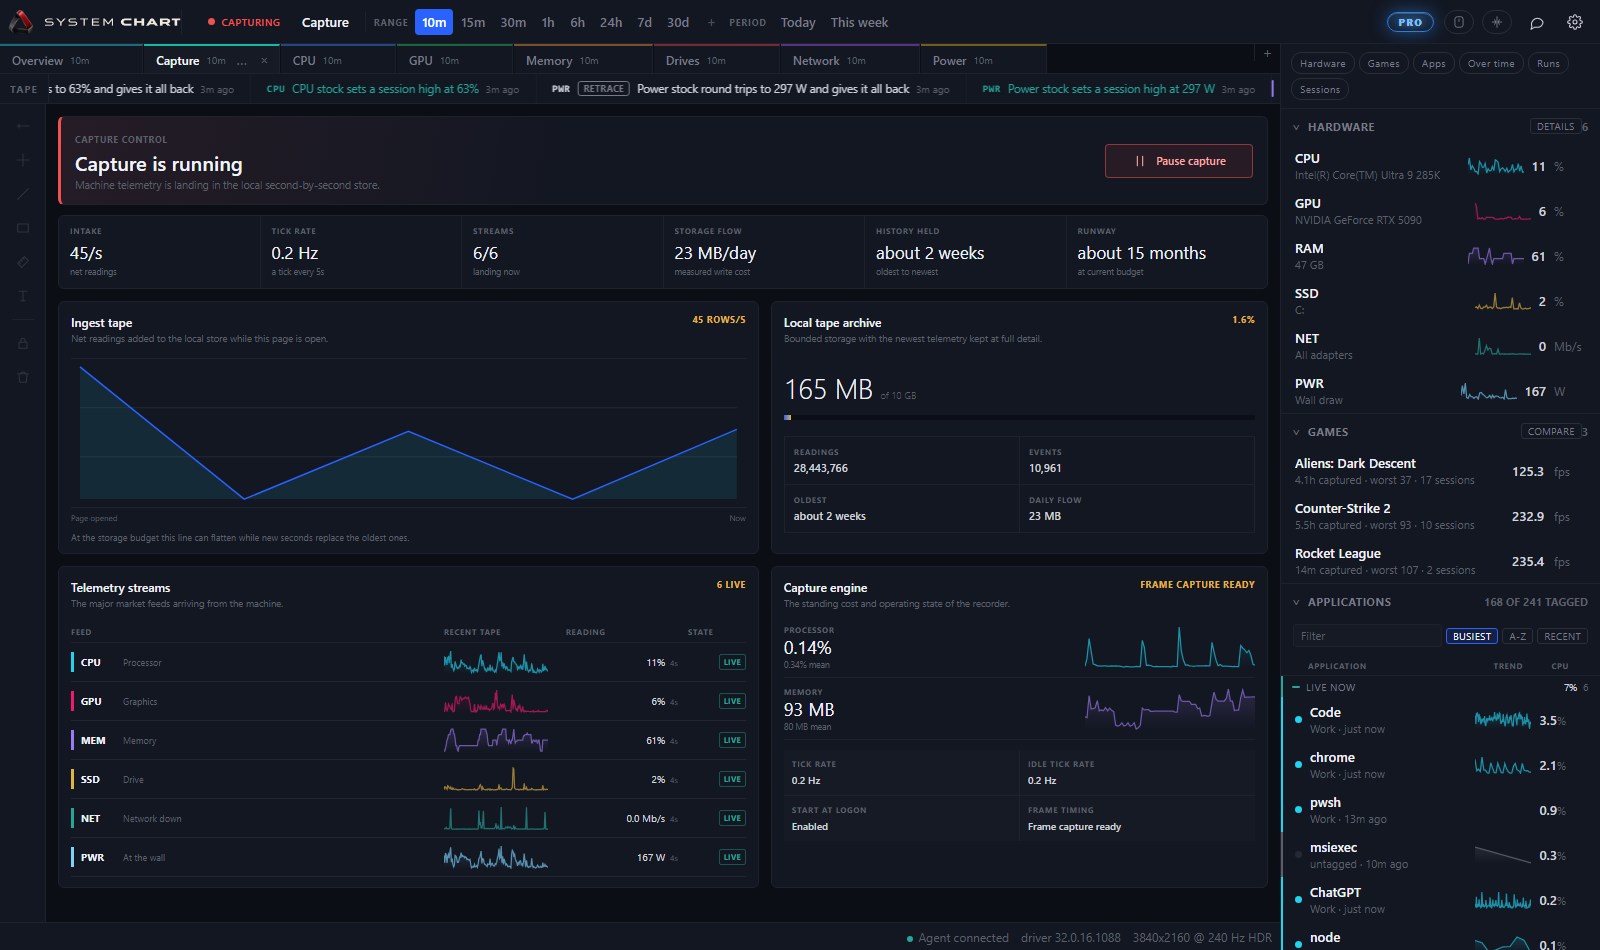
The recorder looking at itself. How many readings are held, how far back they reach, what they weigh on disk and how fast they are arriving, so the span you can ask about is never a guess.
Tracks readings held, the oldest one, size on disk, the measured daily rate, how much of the budget is used, and any break in the record.
Settings
Capture, history, appearance and support settings are kept together. There is no SystemChart account or automatic history sync. A configured hosted assistant sends questions and relevant tool results to the provider you selected.
Most of it you will set once and forget. How far back to keep, and which corner the frame counter sits in, are the two that actually matter on day one.
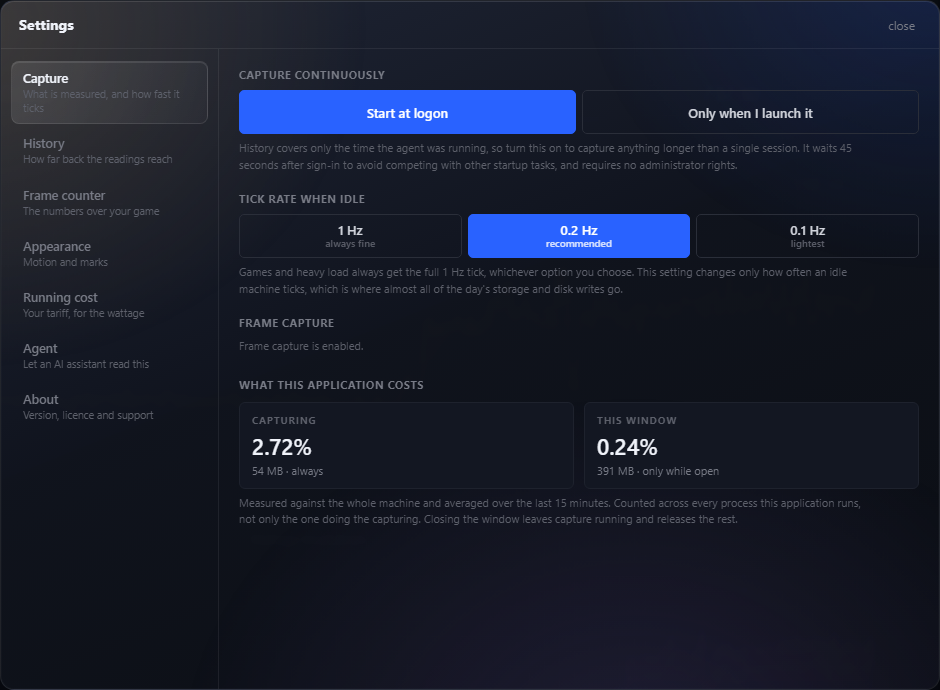
Capture
The recorder runs at 1 Hz and eases to a tick every five seconds when the machine is idle, returning the moment anything happens. Games and anything over 25 per cent load always get the full rate, so a session is never sampled thinly. There is nothing to choose.
Start with Windows lives here too. Capture is worth leaving on because the span you can look across is the span you captured, and a gap cannot be filled in afterwards.
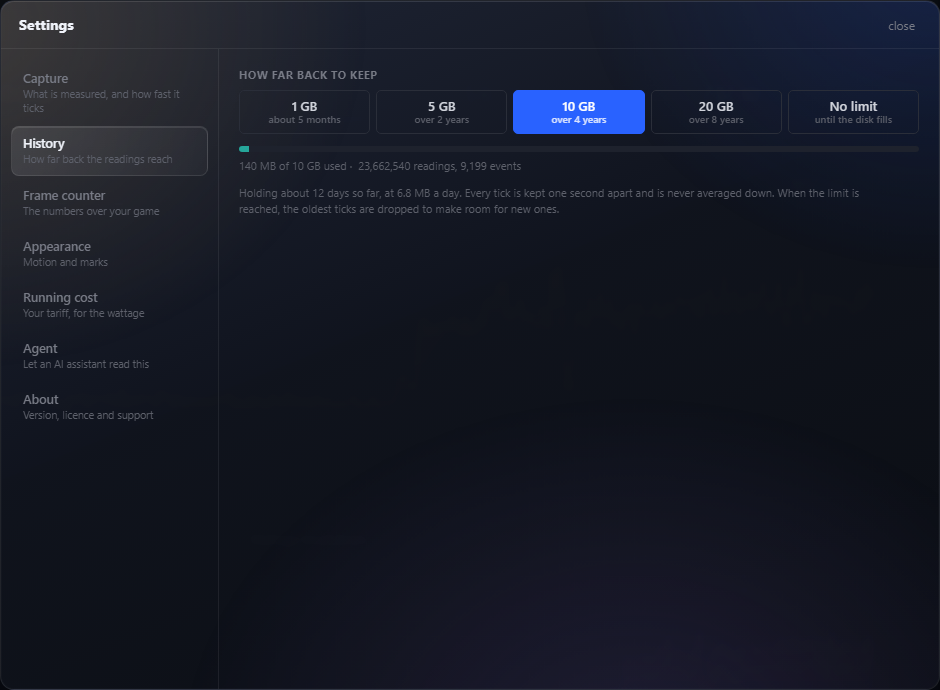
History
Every choice is annotated with what it buys on your machine, measured from your own last day of capture rather than from an average of somebody else's. This one writes about 12 MB a day, so it prints the real span beside each size.
Check the retention window and disk budget shown for your installation. Older readings are trimmed when a limit is reached. Capture gaps cannot be reconstructed afterwards.
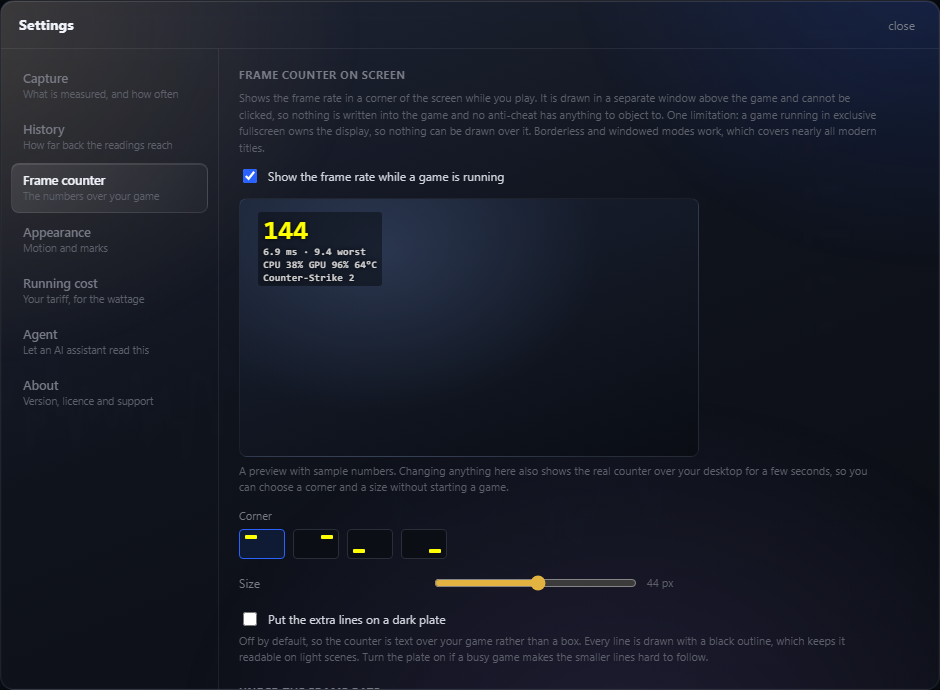
Frame counter
Ten fields, four corners, a size and an optional dark plate. The sketch is live, so choosing a corner shows you the corner instead of asking you to start a game and find out.
Frames get captured whether the counter is showing or not, so turning it off costs you nothing in the record.
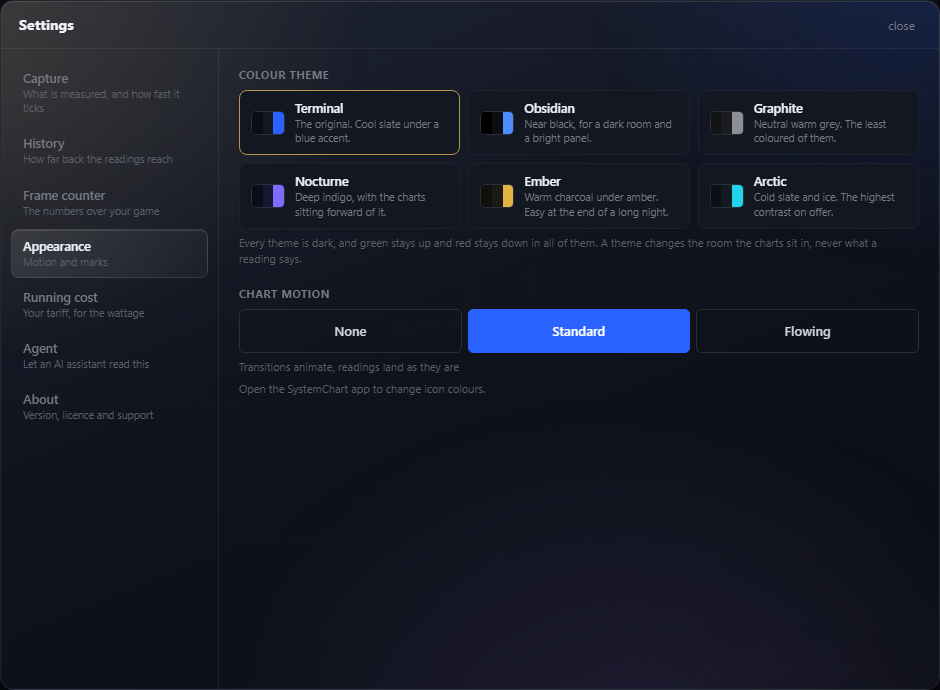
Appearance
Six colour themes and seven finishes for the window icon, the taskbar button and the tray. The tray gets its own choice for while capture is stopped, so you can tell at a glance without opening anything.
Motion is here as well: none, standard, or charts that flow continuously between readings instead of stepping.
Running cost
Set the electricity rate and check the modeled power assumptions. The Power page applies that rate to the energy represented by the captured range.
The app starts with a default rate and can suggest a regional rate from a US ZIP code. Replace it with your own energy rate for a more useful estimate.
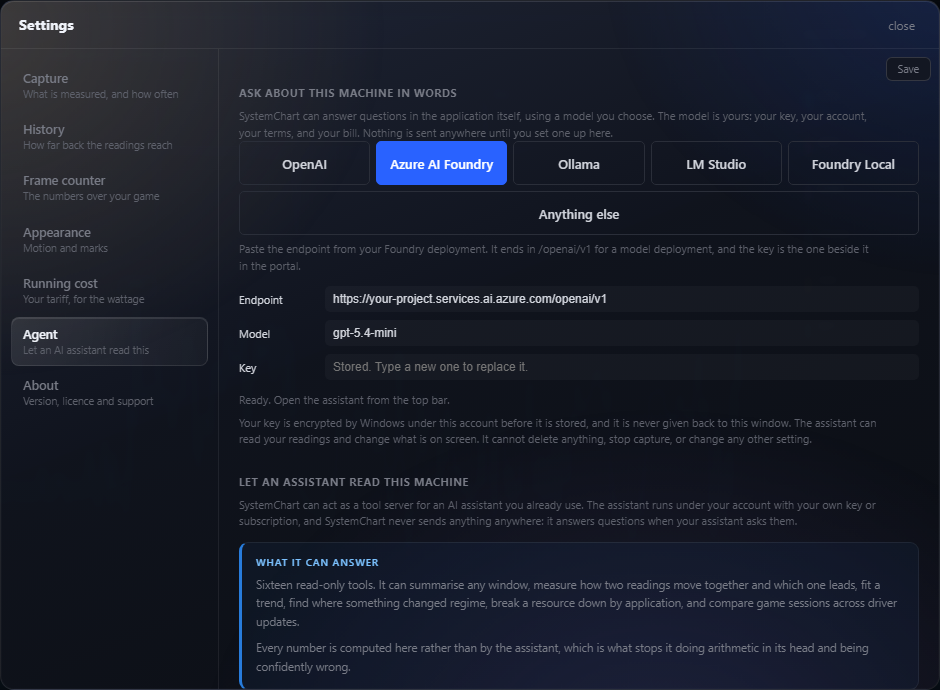
Agent
Pick a provider, paste an endpoint, and the assistant panel opens beside your charts. A model on the same machine needs no key at all. Windows encrypts any key you do set under your account before it touches the disk, and the window that set it can never read it back.
Underneath sits the tool server block, written out with the real path already filled in for Claude Desktop or VS Code, copied on one button.
Report a problem
One button gathers component logs, versions, what your hardware can report and the health of the archive. It leaves out your readings, the process lists it captured, your history, your sessions and your licence. You approve it before anything is sent.
You get back a code like SC-AB12CD34EF. Email that with a sentence about what you were doing and the report can be found. They are deleted after fourteen days. If the window will not open at all there is a separate Support Reporter in the Start menu that sends the same thing without loading the charts.
About
Version, edition, whether this copy came from Steam or direct, how long the recorder has been up, how many readings it holds, how many sessions, the size of the archive on disk and who the licence belongs to.
It is a status page, not a storefront. Nothing on it asks you for anything.
The instruments
Candles, ribbons, distributions, ranked screeners, stacked breakdowns and heat strips. Moving averages, rate of change, dispersion, envelopes and operating zones on any line. Every chart is drawn from ticks, so zooming in goes all the way to the source reading rather than to a summarised average.
Everything the machine reports is a symbol you can chart: the hardware, every application you tag, every game you play. Put a frame rate against a board temperature, or one application's memory against the whole machine's, on one panel and one clock.
A line on its own is just a shape. Shaded zones show where a reading left its normal range. Fixed boundaries are reference points, not universal safety limits. Check the hardware manufacturer's specifications. Capture breaks are marked and can be expanded or closed on the timeline.
A distribution answers the question a line cannot: how much of the range was spent up there. A ranked screener puts every part in order with its own peak marked. A heat strip lays the whole machine out as bands sharing one clock, so a moment can be read straight down.
Pro Manual studies
Six studies, not a hundred. The ones that made it measure level, trend, spread or a limit, which is what any signal has. The rest were built for prices and a crowd, and your machine has neither.
Put any of them on any line, on any page, with your own period, your own colour and your own thresholds.
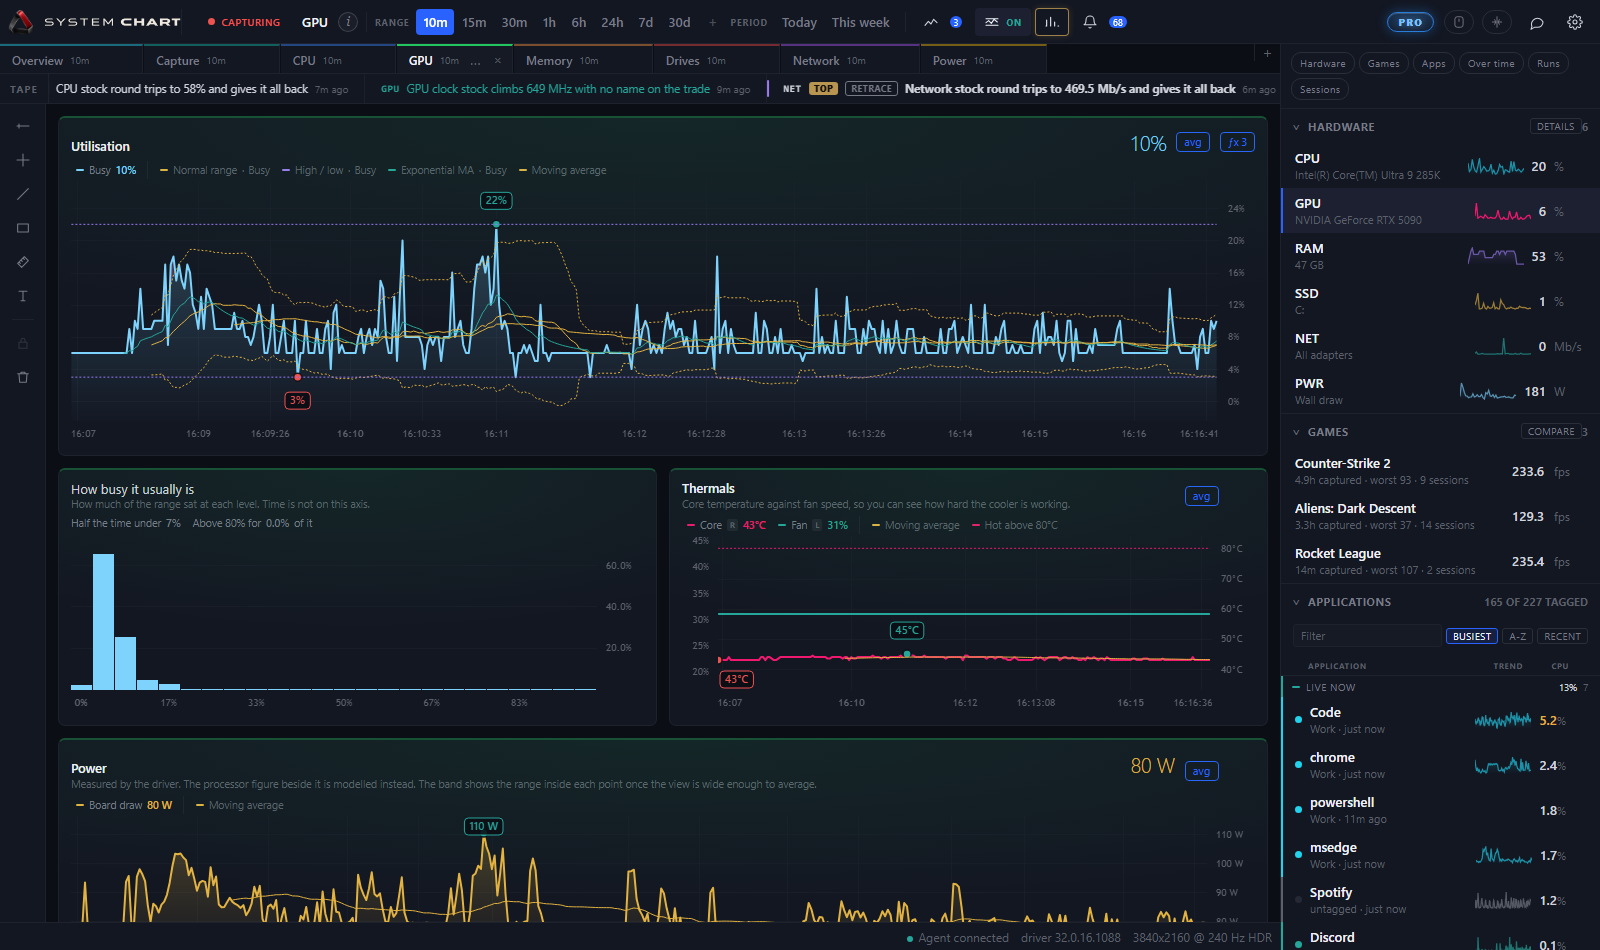
Was temperature limiting this run? Compare temperature, clocks, board power and reported throttle reasons over the same moments. A reference line at 80 degrees is a guide, not a substitute for the card's own limits.
A fan response can follow a temperature change. Compare the traces before attributing a slowdown to cooling. A correlation describes timing, not proof of cause, and room temperature is not directly measured here.
Check the average, 1% low and worst frame together. A single hitch and a sustained change deserve different conclusions. Use the session's captured settings when choosing another run to compare.
An inspection example. Conclusions depend on the readings and context of the selected session.
Moving average
The mean of the last N points. Flattens the noise so the level shows.
Exponential MA
Weighted towards recent points, so it turns sooner than a plain mean.
Normal range
A rolling mean plus and minus N deviations. Outside it is unusual for this window.
Rate of change
Change per minute. Highlights sustained growth or decline without diagnosing its cause.
Limit line
A constant you care about. A thermal ceiling, a power budget, a refresh rate.
High / low
The highest and lowest reading within the chosen rolling period.
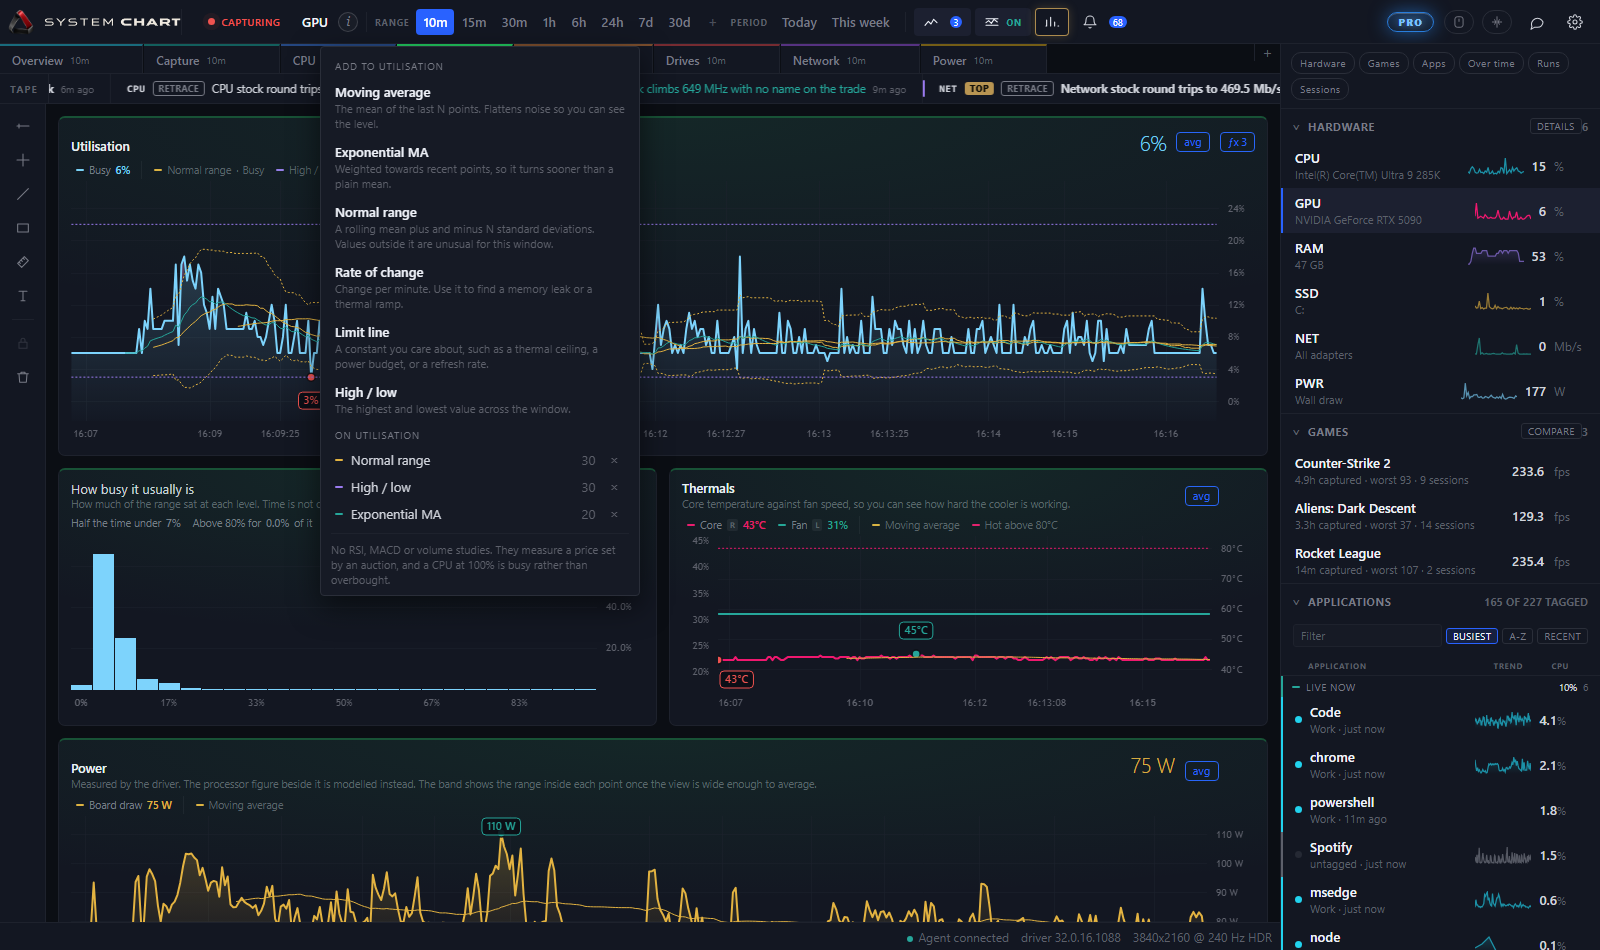
Each one carries a line saying what it measures, so you can pick without looking anything up. The foot of the menu says which studies are deliberately absent, and why.
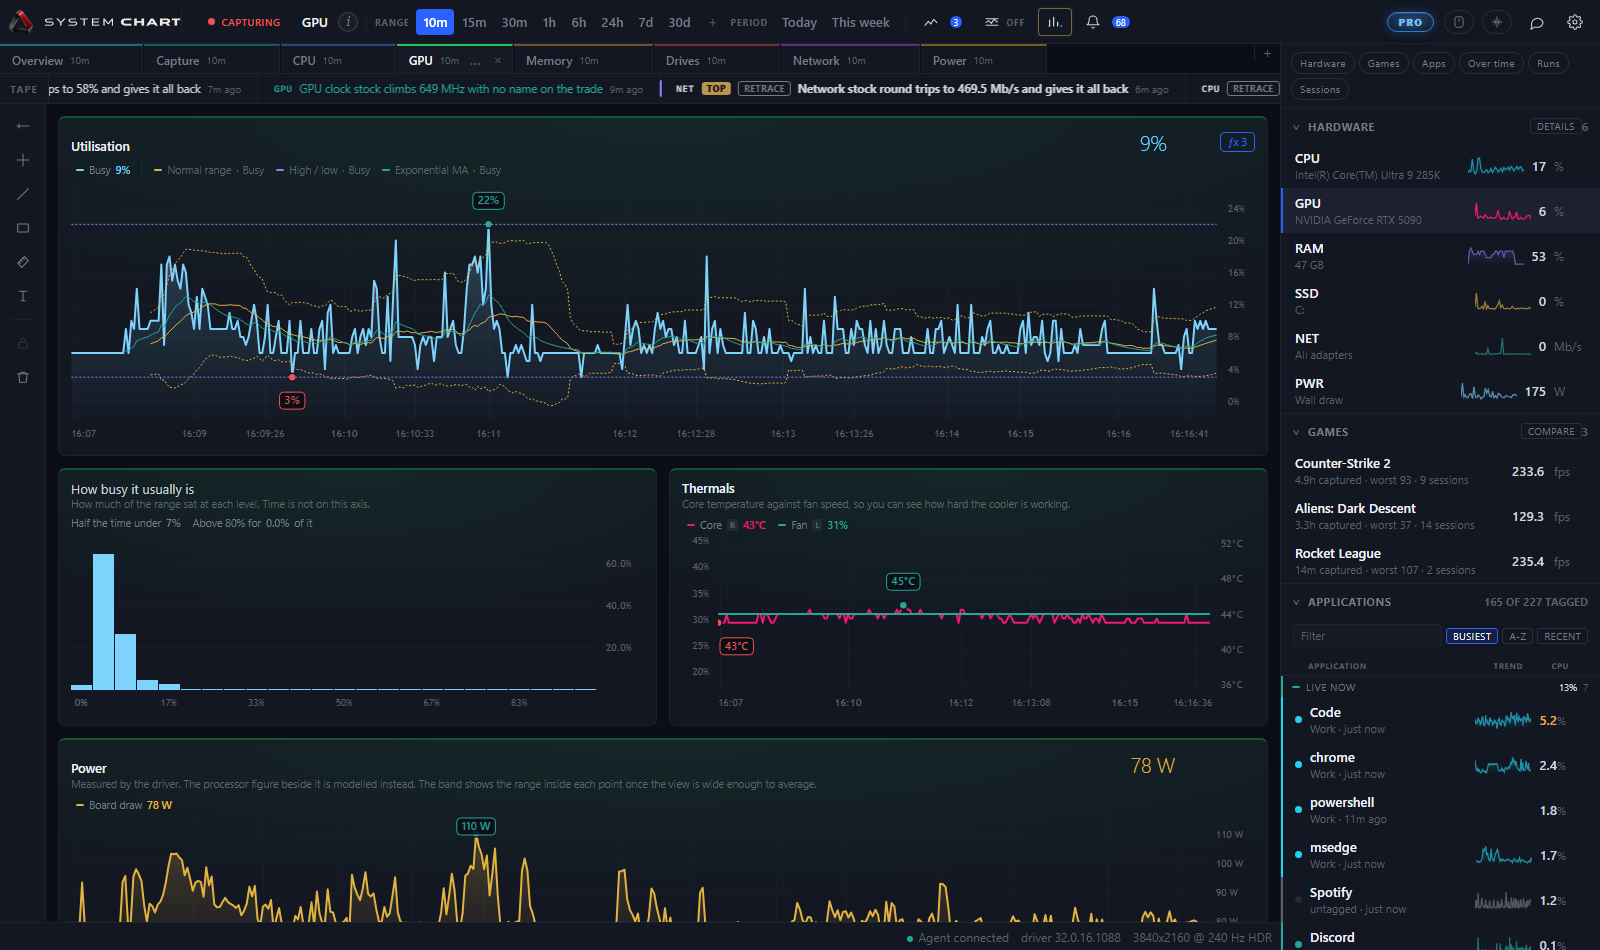
Automatic markup adds appropriate ranges and reference boundaries to eligible charts. The hardware market and frame-rate charts have their own guides. Findings provides a key to the marks currently shown.
Studies live on the page you drew them on, and a page is yours to keep. Add drawing tools, custom limits, Compare and repeated experiments on top, and every one of them still reads without a licence once it exists.
The tape
Every chart in the application answers a question you already had. The tape answers one you did not. It runs under the tabs the way a wire service runs under a broadcast, and it is the only surface here that volunteers anything.
It is written the way the market is written, because the market already solved this problem. Each hardware family is a stock. Something that rises firms, climbs, gaps up or rockets, in that order, depending on how far it went. Something that falls eases, slips, drops or craters. A reading pinned at its ceiling is halted. Two readings that move as one are in lockstep. One that leaves and comes back made a round trip, and there are four ways of saying that too, so a busy hour does not hand you the same sentence six times. The largest moves lead with bullish or bearish. That is the whole of the tape's opinion, and it is still only a direction.
Nothing is ranked by recency. Every candidate headline is graded on how far outside this machine's own ordinary it sat, and only the strongest survives per symbol, so one loud event cannot take the whole tape. Click a headline and it opens onto the captured ticks behind it, with the before and after figures and the exact window they came from.
Nothing on it is predicted, and nothing on it is advice. A quiet machine gets a quiet tape, which is the answer you want most days.
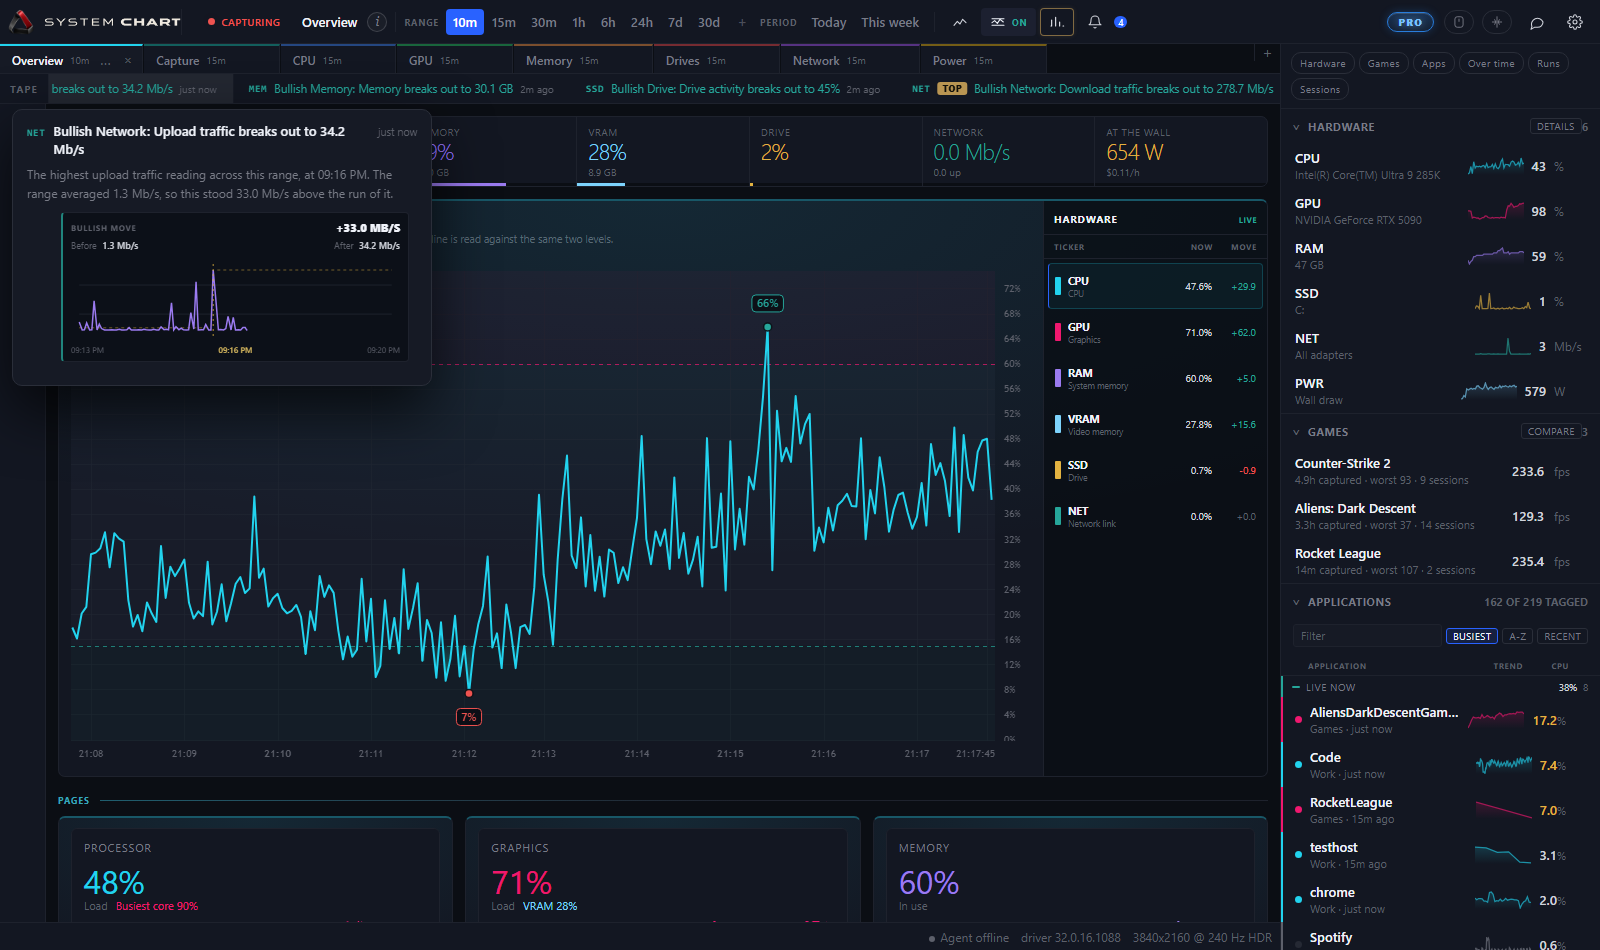
Saved examples from a development machine
PWR
Bullish: Power stock rockets 337 W as Aliens: Dark Descent opens
19h ago
GPU Capped
GPU clock stock halted at 2955 MHz for 9 minutes
19h ago
NET Top Retrace
Network stock spikes to 986.4 Mb/s and hands it all back
20h ago
CPU
CPU stock sets a session high at 100%
44m ago
GPU
Bearish: VRAM stock gaps down 3.9 GB as Counter-Strike 2 closes
3d ago
NET
Network stock sells off 31.9 Mb/s on the handoff from Visual Studio Code to Edge
2h ago
MEM
Memory stock sets a session low at 15.5 GB
4h ago
GPU
GPU clock stock gaps up 1648 MHz with no name on the trade
3h ago
These examples are snapshots, not a live feed. In the application, a headline opens the captured evidence behind it. With no name on the trade means the available attribution did not explain the move, not that no application was responsible.
While you play
The counter is a separate click-through window. It does not inject code into the game process. Compatibility still depends on the game, display mode and security software; no universal anti-cheat or antivirus guarantee is made.
Ten fields to choose from and a corner to put it in. Frames get captured whether the counter is showing or not, at the game's own rate, so every session leaves a page behind with its lows, its worst frames, and how it compares to the last time you played.
The live counter uses a rolling half-second window, refreshed up to ten times a second. Stored frame statistics keep their original cadence. A game's own FPS display may use a different window or count a different stage of rendering.
Pro After you play
Two evenings both averaging 140 frames are the same number and a different night. One of them held steady the whole way. The other spent a fifth of itself in the twenties and made the average back up somewhere nobody was looking. The average is the one figure that hides exactly the thing you felt.
So the session gets drawn against the ladder instead. Seven bands, from Struggling to Machine God, and the area under the trace is filled with whichever one it was in at that moment. Underneath, the same run with time taken out of it: how much of the evening was spent where.
Then hold another night against it. Runs are lined up by offset from their own start rather than by the clock, because they happened on different evenings and the question is how they compare minute for minute.
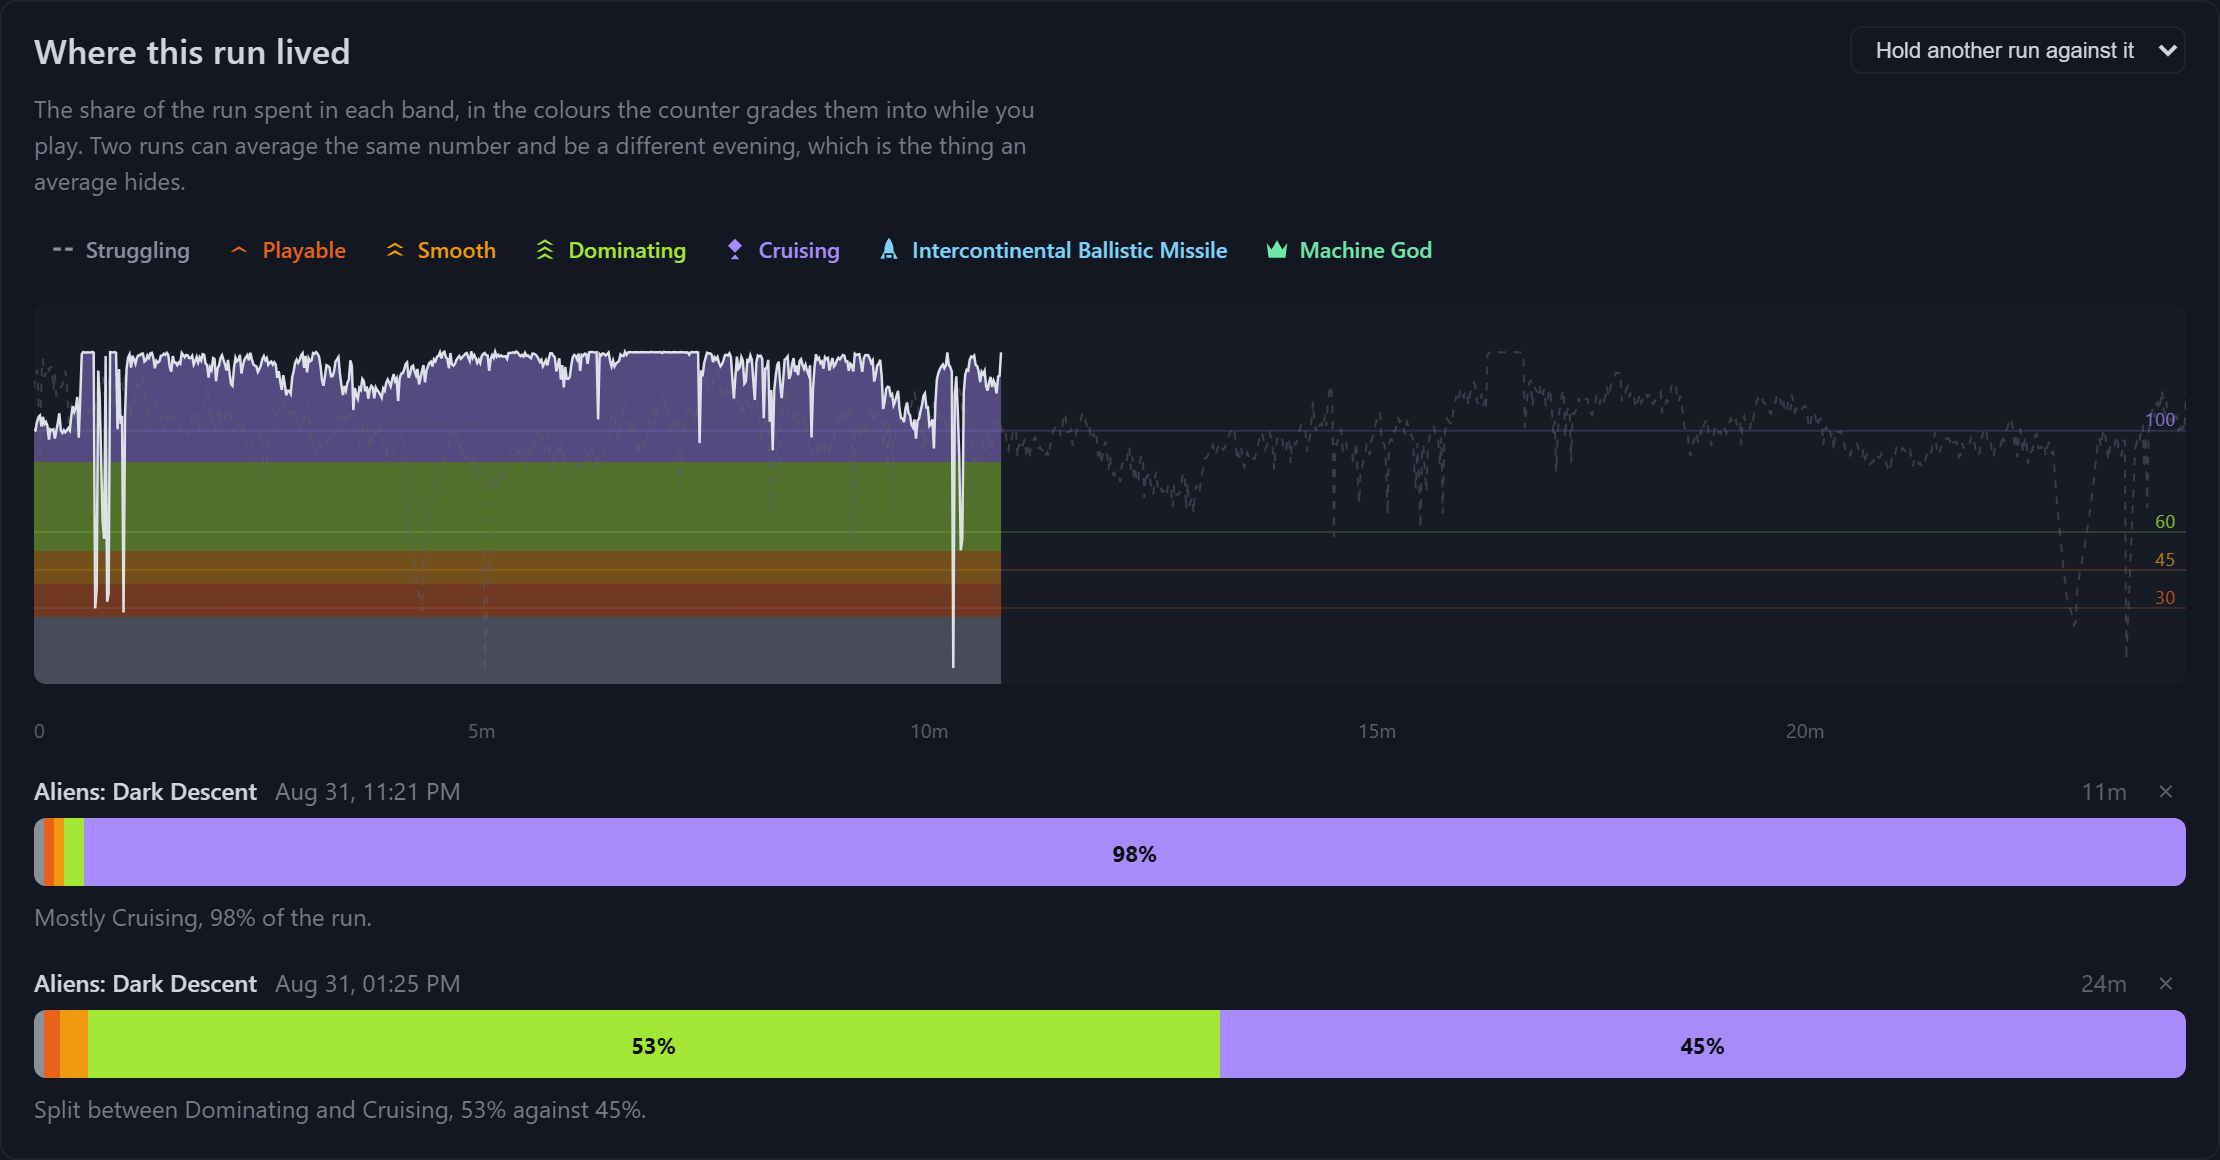
The bands and the seven rungs beside them are the ones from the counter over the game. Somebody who has watched Cruising sit in the corner all evening already knows what the purple means here without reading a word of it.
A run resting on a threshold is not counted in two bands at once. The same hysteresis the badge uses is applied to the history, so what this counts is what would actually have been on screen.
Every frame is captured and charted without a licence, and the session page keeps its frame rate, its lows, its worst frames and its verdict. Pro adds the ladder those numbers are read against, and holding one evening up to another in it.
Keep the investigations you build: your pages, studies, drawings and comparisons. Connect a model you choose when you need a different way to query the evidence. Core capture and default diagnostics stay available without Pro.
Manual studies on the same captured readingsSix colour themes
All dark, and green stays up and red stays down in every one of them. A theme changes the room the charts sit in, never what a reading says.
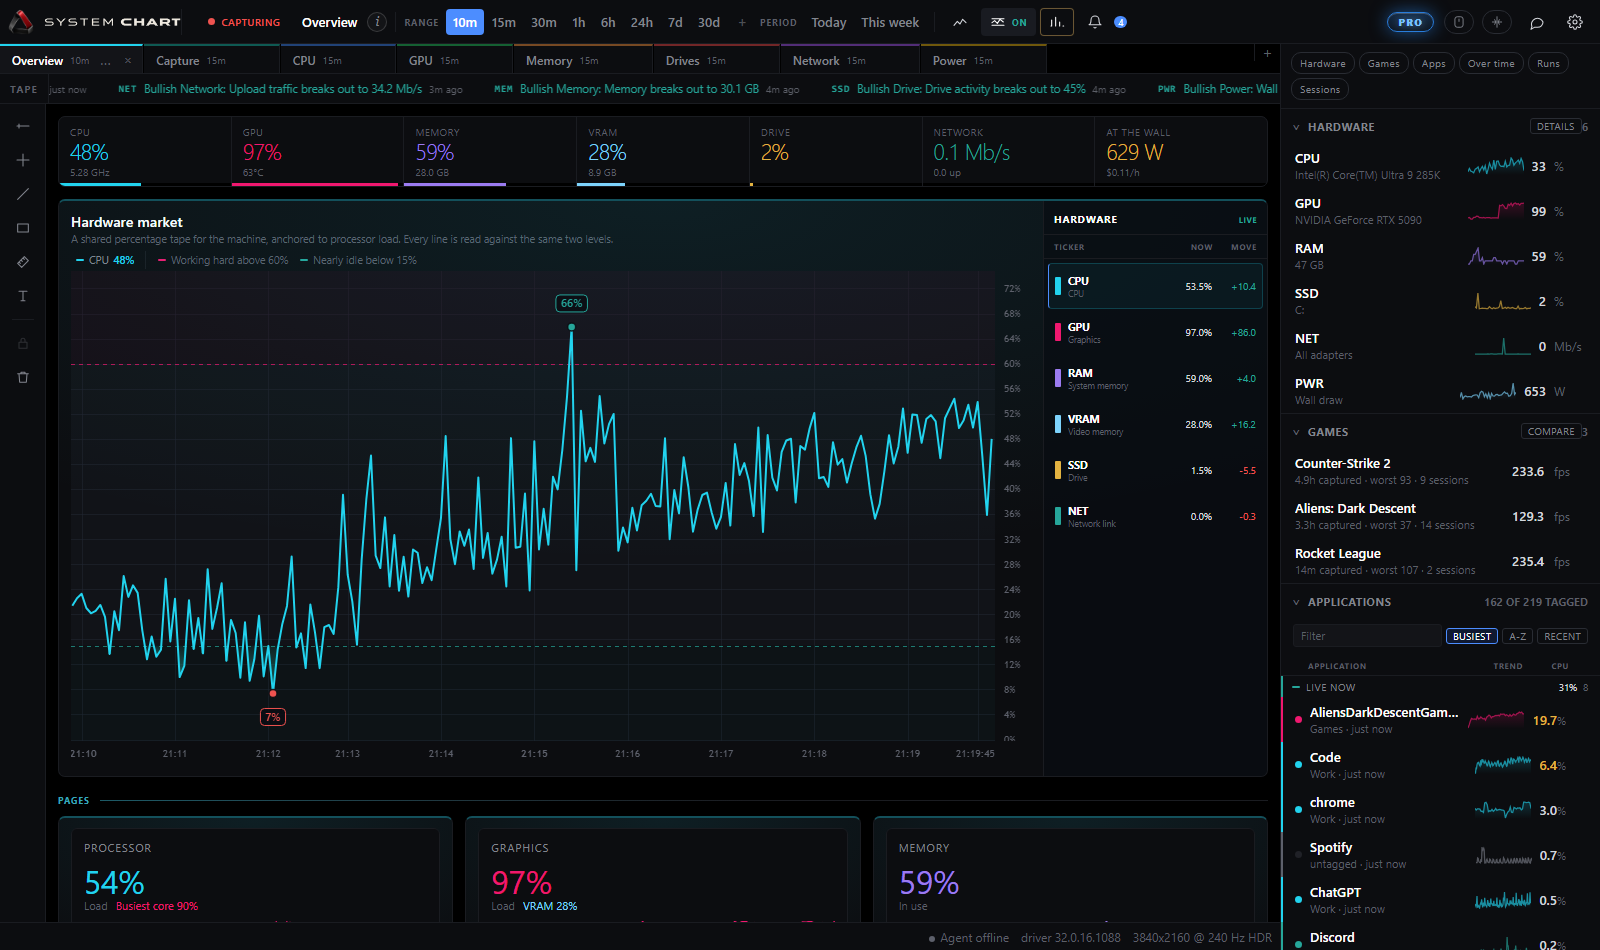
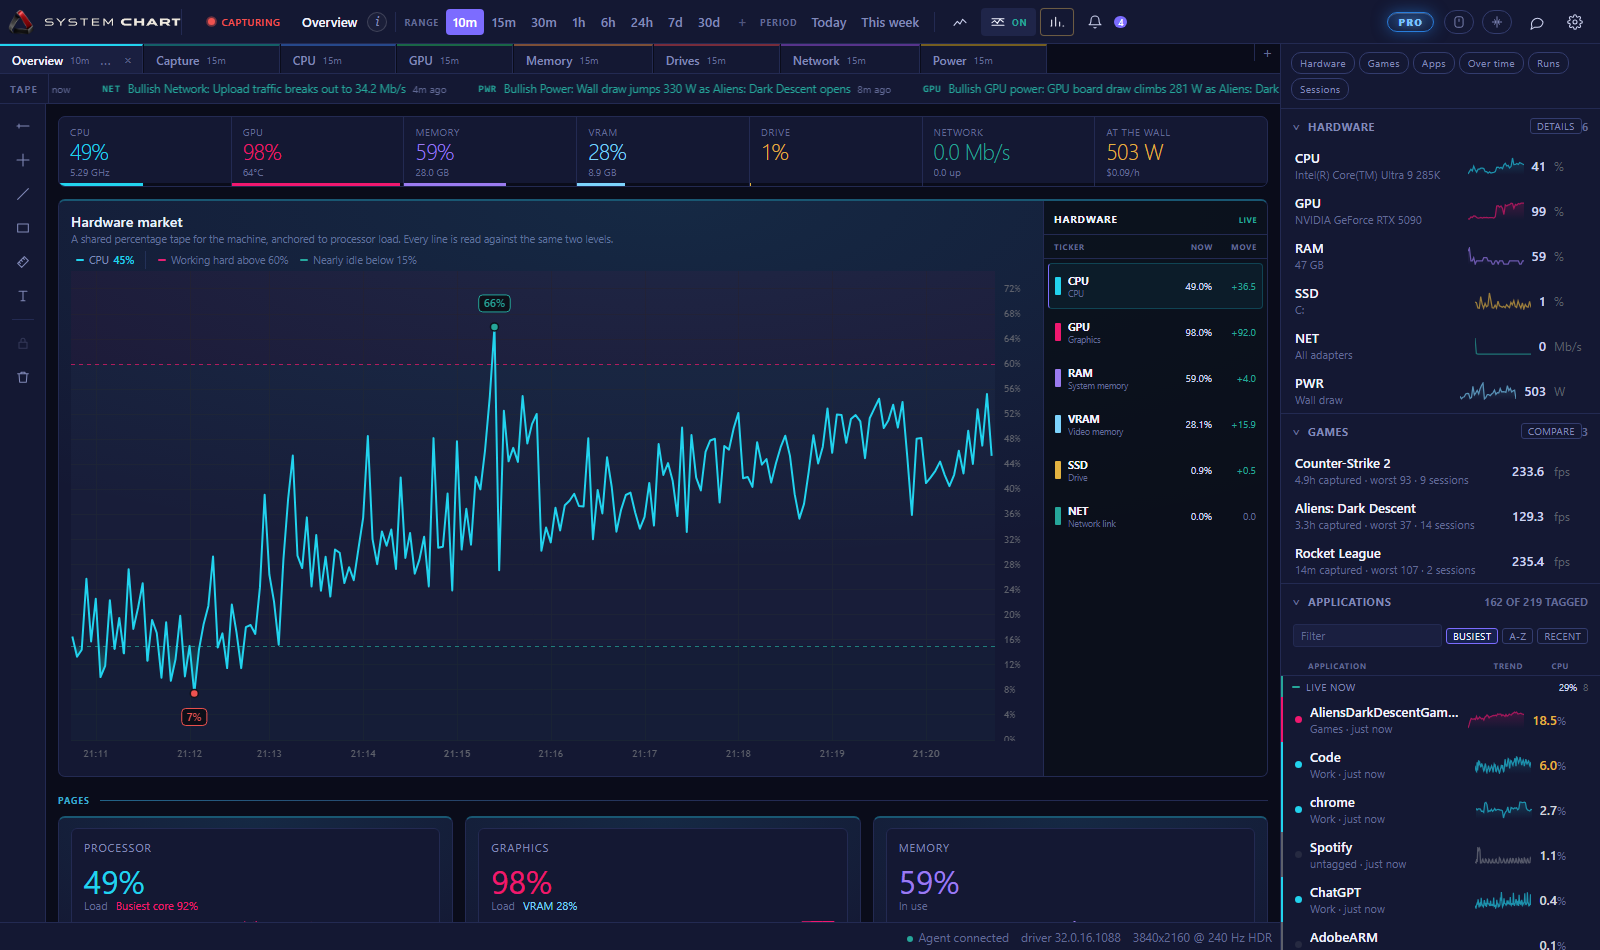
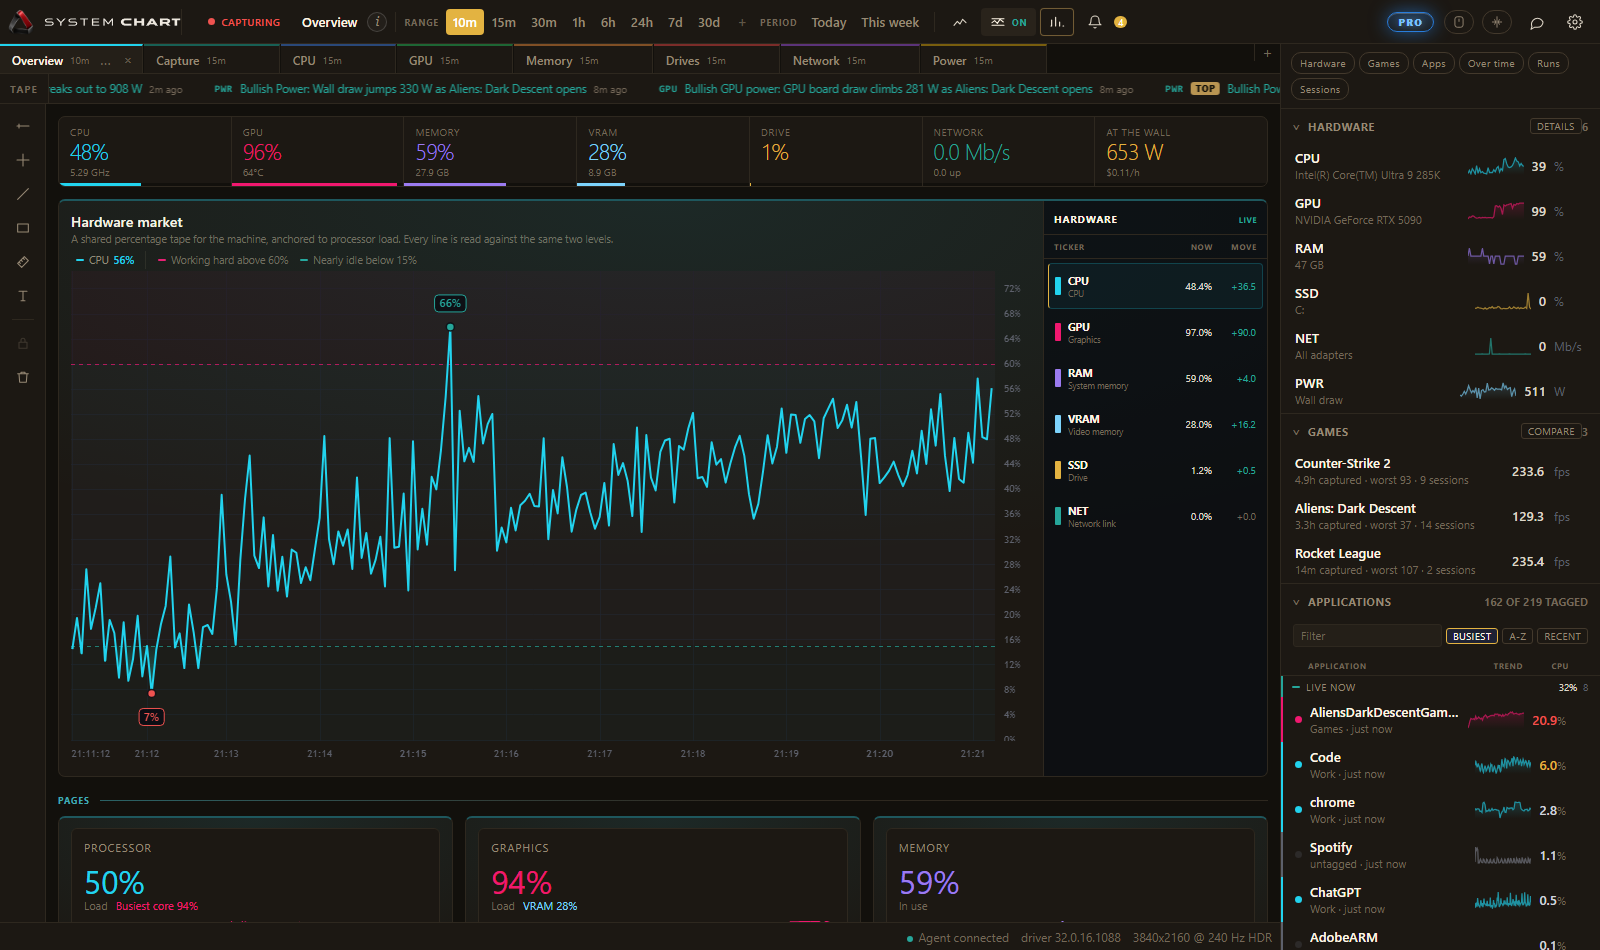
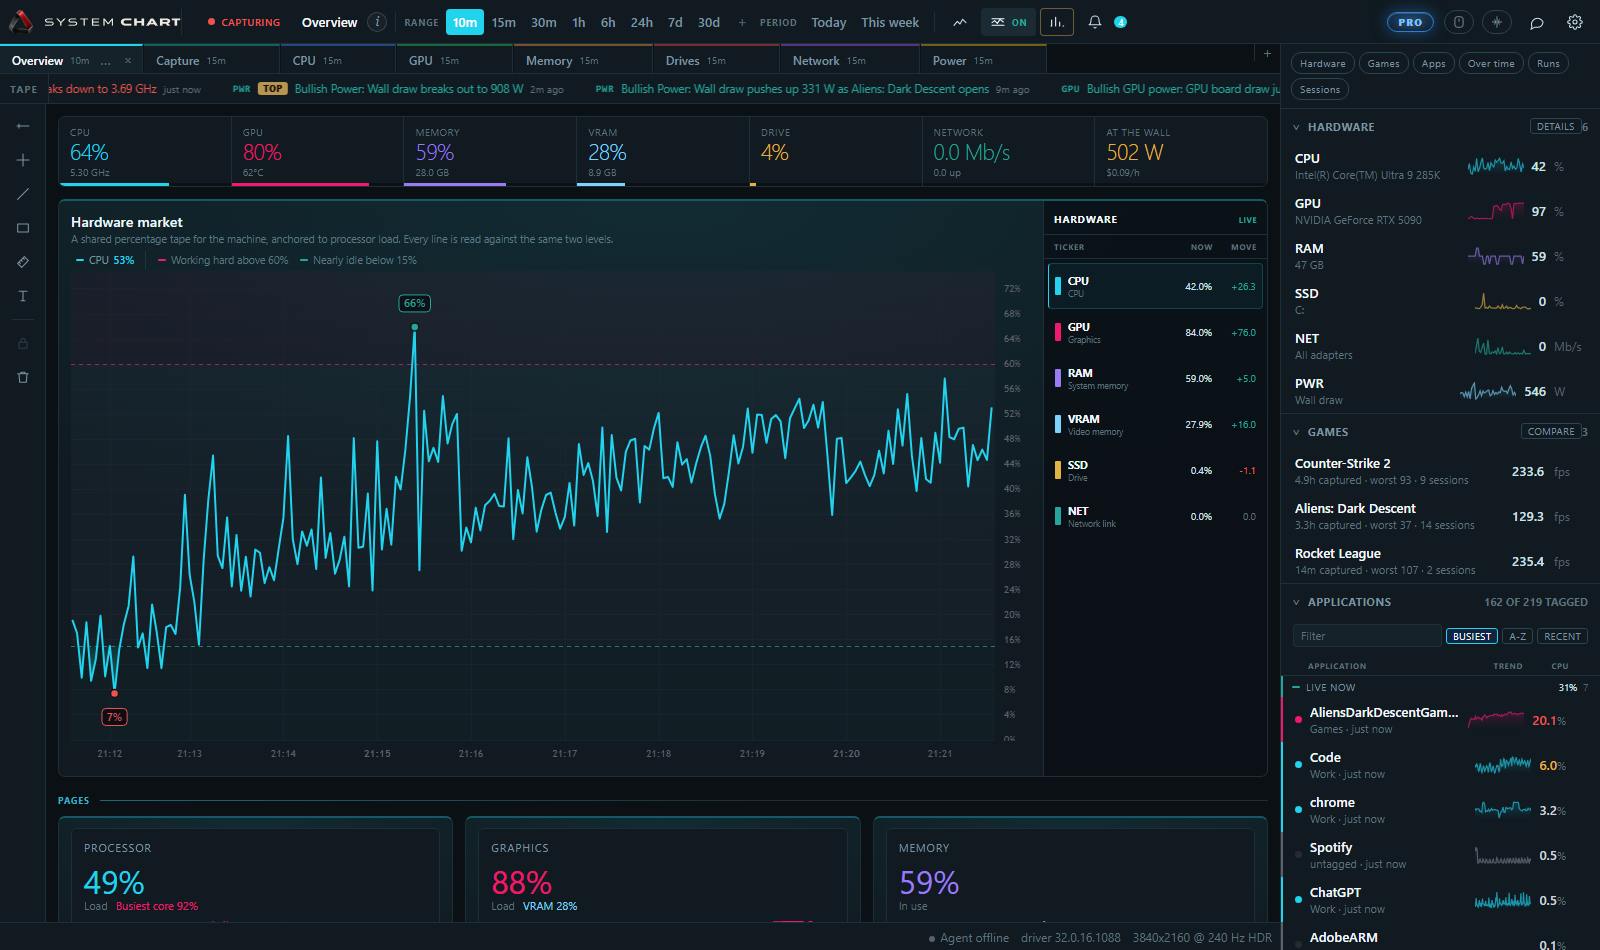
Graphite and Terminal complete the set. All six are one click in Settings.
| Surface | Free | Pro adds |
|---|---|---|
| Capture | Every data point, the full 1 Hz tick, autostart, pause and resume | Nothing. Capture is never gated. |
| History | The last two months, at full resolution, nothing averaged down | As far back as the disk you give it, up to no limit at all |
| Pages | Hardware overview, Process overview, Capture, CPU, GPU, Memory, Drives, Network, Power, Machine | Pin and rename tabs, editable copies, blank pages, the chart palette, saved layouts |
| Applications and games | Attribution, tags, category pages, game and session pages, peer comparison | Nothing |
| The tape and findings | All of it, with the captured evidence under every headline, including anything a watch caught | Writing watches of your own |
| Analysis | All timeframes, automatic markup, operating zones, findings, trends, what changed | Manual indicators, drawing tools, custom limits, Compare, before and after, repeated experiments |
| Frame counter | The counter, its corner and its size | The ranked badge, the machine readings under it, and the session graded against the ladder afterwards |
| Appearance | Every finish for the window, taskbar and tray, and the Terminal theme | Six colour themes |
| Assistant | None | The panel in the window and the tool server, against a model you supply |
Pro is one payment, once, on Steam. A licence that lapses leaves every reading, every page and every theme you already chose exactly where they were. History captured under a licence is never taken back: the span stops growing, it does not shrink.
Assistant
SystemChart holds millions of ticks that no chat window can read on its own. So it exposes them the way a database exposes rows: as a set of tools an agent can call, each one running a real function over your stored readings and handing back a figure it did not invent.
Use the in-app panel or connect an existing assistant through Model Context Protocol. You choose the provider. Local tools query this machine; hosted models receive the questions and relevant tool results needed for the conversation.
Paste an endpoint and a key and the panel opens beside your charts. A model on the same machine needs no key at all, and Ollama, LM Studio and Foundry Local are one click each.
SystemChart is also a Model Context Protocol server, so the assistant you already pay for can read this machine directly. Settings writes the whole configuration block with the real path in it, for Claude Desktop or for VS Code, and copies it on one button. Between reading about this and using it sits a paste and a restart.
Windows encrypts any key you set under your account before it goes near the disk. The window that set it never gets it back.
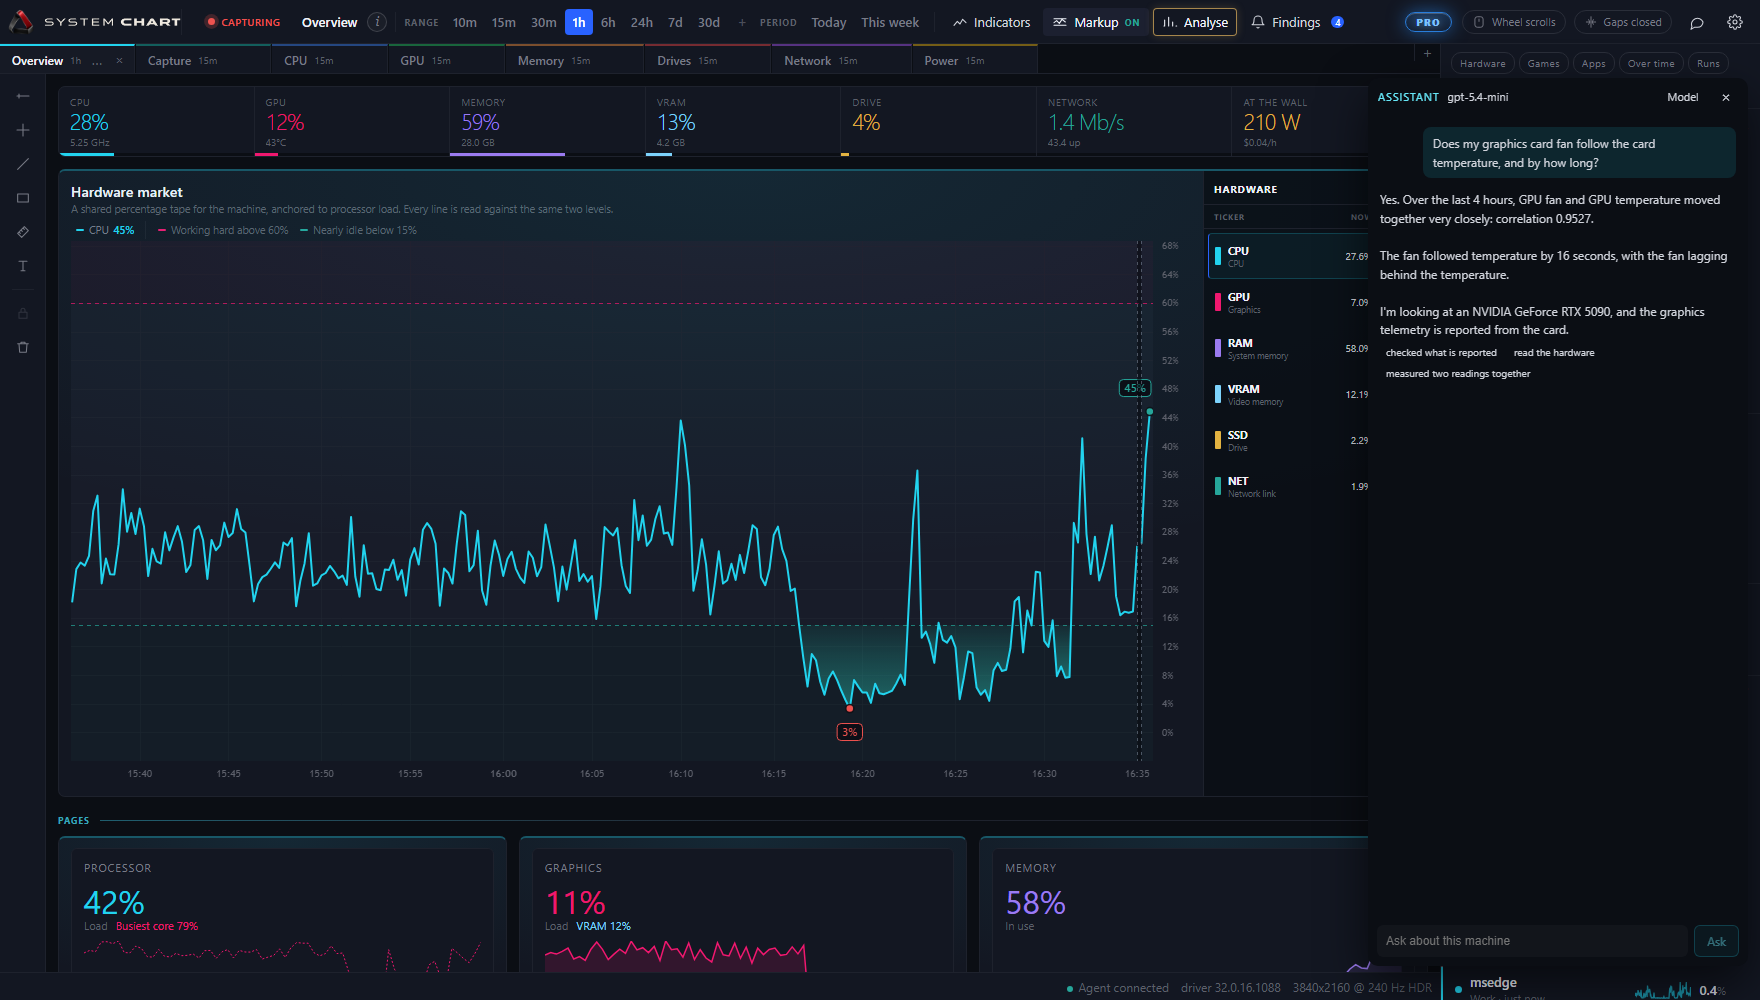
The chips under an answer name every tool that ran to produce it. Open the same page over the same window and the same numbers come up, because they came from the same readings.
Ask about a window with no ticks in it and it says so. A reading that never moved gets named as such rather than reported as a zero, which is the difference between a steady fan and a fan that has stopped.
Put to gpt-5.4-mini through Azure AI Foundry, against this machine's own 24.9 million readings. Three consecutive turns, unedited, tool names as the panel prints them.
My machine felt slow last night. Anything actually happen, or was it me?
Probably not much was wrong.
Over the last 12 hours, the charts show:
What I do not see is a clear sustained spike in disk latency, GPU load, or a hard CPU bottleneck. There was a brief CPU max, but the summary does not show a lasting event.
I’ve opened the Overview page at 12h so you can look at the same window. If you want, I can narrow it to last night and check for a specific spike or change point.
That power spike, what was the graphics card doing at the same moment, and did it get hot enough to matter?
At the power step, the GPU was also active: power and GPU load moved together very closely, with correlation 0.9738 and no lag.
What the GPU was doing:
Did it get hot enough to matter?
I’ve put the GPU page in front and set it to 12h so you can inspect the same window. If you want, I can look for the exact power step timing against GPU temp or fan behavior.
Which application costs me the most processor over a normal day, and is that reasonable for what it is?
The biggest processor user over a normal day was AliensDarkDescentGameSteam-Win64-Shipping at 17.74% of the whole machine.
Is that reasonable? Yes, for a game that’s a plausible CPU share, especially on this machine:
Other notable users were:
There was also 1.36% not attributed, which means some short-lived processes were seen between sampling walks.
This is a saved transcript, not a guarantee of model accuracy. Tools compute the statistics, but a model can still misstate or overinterpret them. In the last answer, short-lived processes may be missed between walks, not necessarily seen. Wall power is estimated. Compare important claims with the underlying chart and use comparable workloads before drawing conclusions.
Sixteen of these only read and four change what is on screen. One writes: it sorts applications into a category you have already named, which also tells SystemChart to record them on every walk. An assistant may hold forty at a time, cannot create a category, cannot overwrite one you set, and cannot remove anything. Settings lists what it tagged and gives it all back in one click. Nothing writes a tick, deletes one, or changes capture settings. Restricted tools reduce the impact of misleading instructions, but do not guarantee a correct answer or appropriate action. The panel and the tool server offer the same twenty-one, compared against each other on every build after they drifted apart once.
Availability
The direct beta is available now. The Steam page is still in review. Check the download page for the published version, signature and installation details.